

Fixed Income? Time to Think Differently
EXECUTIVE SUMMARY
Sourcing income and managing risks will be challenging as fixed income markets sit at a new juncture. It is time to reconsider the global sovereign bond market, but not in its traditional sense. Dynamic, active country selection that draws less of a distinction between developed and emerging markets can uncover higher-yielding opportunities, adding diversity and managing downside protection. In markets where interest rates are rising, income opportunities can be sourced by exploiting steep yield curves. Rather than abandon duration, investors should be embracing it.
Investors need to consider more innovative and flexible fixed income investment approaches. Following a 30-year bull market cycle, developed market bond yields are residing at historic lows, thanks to the massive injection of monetary stimulus. The US economic recovery cycle is progressing to the point where the Federal Reserve has already started to slow the pace of market liquidity, while interest rates are expected to start increasing in mid-2015. How the Fed manages its exit programme from emergency liquidity will have important implications for all asset markets and could increase volatility. It leaves investors with a conundrum: where can investors find sustainable income?
CREDIT OVERLOAD
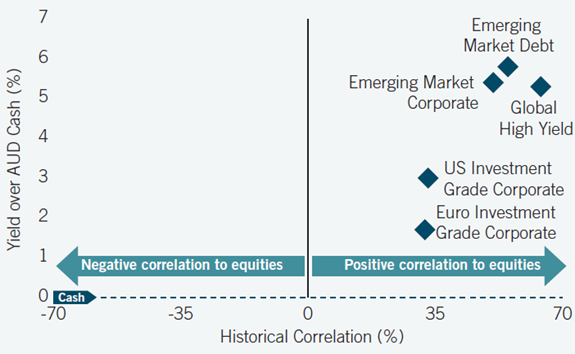
Fixed income solutions have been overly focused on credit markets. In the post-financial crisis era, investors have crowded into credit on the premise that income and risk increase commensurately. As valuations of higher-quality investment-grade corporate bonds have richened, investors’ search for yield has moved lower down the capital structure. The approach has worked well since 2009. Investment grade, high yield and emerging market debt asset classes have all delivered strong returns. Current credit spread valuations are fair, and these sectors continue to deliver reasonable income levels over cash (around 3% for investment grade and 5% to 6% for high yield1). Corporate default rates are expected to stay low, leaving some margin for extra improvement.
However, in addition to income, there are two other design features of fixed income: diversification and capital preservation. The importance of these two factors has been amplified as fixed income markets sit at a new juncture of Federal Reserve tightening. Credit has a higher correlation to equities than global sovereign bonds. It diversifies within fixed income but not against equities (see Figure 1, page 2). During times of market stress, credit’s ability to diversify and protect capital is compromised. By relying too heavily on a credit allocation, investors may miss the defensive characteristics that a bond portfolio typically provides through more turbulent markets, when correlations between credit and equity markets tend to rise.
Figure 1: Increased Correlation vs. Equities*
Current Yield Above Cash vs. Historical Correlation
Last 10 Years
As of 31 Mar 2014
Sources: UBS, Barclays, JPMorgan, BoA Merrill Lynch, MSCI and T. Rowe Price
* Yield shown is on a hedged basis in Australian dollar terms. Volatility is based on the monthly returns of each asset class hedged into Australian dollars.
In seeking to diversify and manage downside risk, investors need to consider other means of finding income. Using the term premium can help to achieve these objectives. With yields at historically low levels, there is clearly much more room for yields to rise than fall. However, in a low volatility, low inflation world with heavy central bank activism, this asymmetry is probably not as extreme as it may first appear. Extending duration and exploiting steep yield curves are ways of accomplishing sustainable income, diversification and downside protection.
NOT ALL CENTRAL BANKS WILL FOLLOW THE FEDERAL RESERVE
Extending duration would seem counterintuitive in the current environment dominated by Federal Reserve policy manoeuvres. Market convention holds that when yields are moving higher, fixed income investors should shorten duration and move closer to cash to avoid capital loss. Inevitably, monetary and economic developments in the US will affect some sovereign bond markets, but there are opportunities for differentiation, as well as increasing evidence that markets are decoupling from the Federal Reserve.
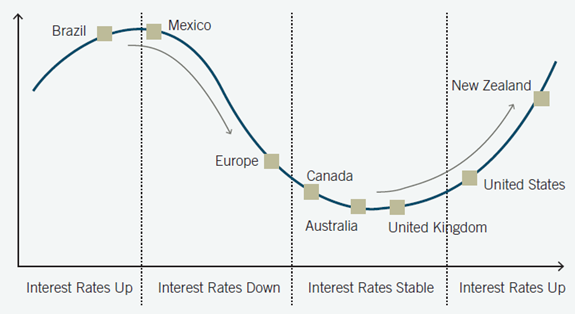
While markets operate within an interrelated global economy and can be often somewhat correlated, individual sovereign bond markets are ultimately driven by their own interest rate and economic cycles. Even among the major economies, which coordinated emergency monetary policy easing in 2008, there is currently more dispersion between macroeconomic cycles and fiscal and monetary responses. In practice, this means greater decoupling from the Federal Reserve.
Figure 2 illustrates the hypothetical interest rate cycle between various sovereign bond markets. In Mexico and Brazil, for example, interest rates are already close to the peak of their monetary cycles. Other sovereign bond markets, like the Eurozone, are unlikely to raise rates for the foreseeable future because of low economic growth prospects. Economies that are further along in their recovery cycles will also be in the later stages of their interest rate cycles. Tightening cycles should not always be viewed negatively. Investors need to consider how much tightening the yield curve has discounted to look for valuation opportunities at different maturity points—discussed in more detail below.
Figure 2: Not All Central Banks Are Created Equal
Data as of 31 Mar 2014
QUALITY INCOME OVERRIDES THE TRADITIONAL APPROACH
Selecting term-premium opportunities across the global sovereign market, there is a fading distinction between developed and emerging markets. Instead, investors should be focusing on the quality of income, assessing closely countries’ ability and willingness to pay. Economic and fiscal indicators are bond supportive in a number of smaller country bond markets, of which many are rated “A” or above, with attractive yield premiums.
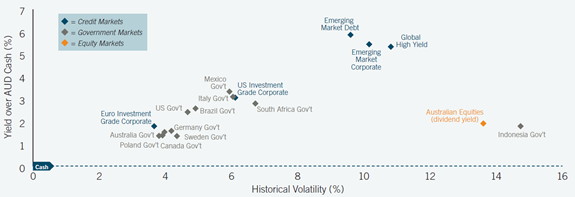
Figure 3 shows higher-yielding sovereign bonds in Mexico, Italy and South Africa against lower-yielding Australian and Canadian bonds on a hedged basis. Those higher-yielding markets offer comparable yield and risk profiles (yielding around 3% over Australian dollar cash on a hedged basis as of 31 Mar 2014). In addition, correlations versus Australian equities for Mexico, Italy and South Africa are much lower than for global high yield, emerging market corporate bonds and emerging market hard-currency debt (over the 10-year period ended 31 Mar 2014). These lower correlations are significant considerations when building a portfolio; investors are able to source income with minimum levels of volatility and better diversification.
Figure 3: Selective Government Markets Offer Attractive Premiums to Cash*
Current Yield Above Cash vs. Historical Volatility Last 10 Years
As of 31 March 2014
Sources: UBS, Barclays, JPMorgan, BoA Merrill Lynch, MSCI and T. Rowe Price
*Yield shown is on a hedged basis in Australian dollar terms. Volatility is based on the monthly returns of each asset class hedged into Australian dollars.
Sovereign bond markets might provide diversity against equities but that does not address correlations to a rising US Treasury market. When US interest rates are rising, the rest of the world does not necessarily follow. Australian government bonds significantly decoupled from the US during the 2004 Federal Reserve rate rising cycle. It coincided with the Reserve Bank of Australia entering into a period of monetary easing. Australian government bond correlations versus US Treasuries fell to a cyclical low of 0.2 in December 2004 from 0.7 in January 2004.2 It highlights that many markets, including developed ones, have lower or relatively unstable correlations versus the US. The notable exception would be Canada, where correlations are broadly stable to the US (0.9 as of 31 Mar 20143).
More diverse and higher-yielding opportunities can be found outside of the major markets where correlations are consistently lower versus the US. The correlations of Mexico, South Africa and Indonesia have averaged below 0.5 over the last 10 years ended 31 Mar 2014.4 Mexico, South Africa and Indonesia are markets where debt sustainability indicators are improving. On a hedged basis, they offer an attractive yield over Australian cash (between 2.0% and 3.5% as of 31 Mar 2014). Brazil also offers a reasonable yield over cash at 2.6% (as of 31 Mar 2014), but fundamentals are less compelling until there are clearer signs that the authorities are controlling inflation. If that occurs, Brazilian bonds could offer an attractive entry point.
These differentiated examples illustrate how investors can diversify interest rate risk while at the same time capturing income gains. It is important to have deep research resources to access the growing pool of sovereign bond markets. Analysts will look for credits that combine good fundamentals and attractive yields. A robust trading platform to overcome potential liquidity challenges in some of the smaller markets is also crucial.
INCOME PROTECTION WITHIN THE YIELD CURVE
Yield curves in developed country markets are historically steep and that provides the second area where investors can exploit the term premium. Current curve steepness between the 2- and 10-year parts of the sovereign curves in Australia and the US is 127 basis points and 230 basis points (as at 31 Mar 2014), respectively. These levels are double the 20-year income average in the yield differential between those maturity sectors. As investors debate the Reserve Bank of Australia’s next policy move, the Australian government bond market has already priced in significant interest rate rises. The Federal Reserve is managing expectations carefully through forward guidance. These situations can potentially open attractive valuation points along the yield curve, if investors can pick the right spots.
In the case of the US Treasury market, the trend of curve steepness between the 2- and 10-year sectors is likely to stay in place based on the pricing of one-year forward rates. The yield curve’s current structure in the US should lead investors to take exposure to longer-dated maturities versus shorter-dated maturities, even when rates are rising. Based on an estimate of the yield protection from carry and roll down versus historical volatility over a one-year period, 5-year US treasury yields would have to climb 60 basis points before they would start to incur a capital loss. Most investors do not expect yields to rise that much based on current market pricing.
Using economic analysis, active managers can consider a wide range of sovereign bond markets, where rate rises have been discounted by the market or where central banks are likely to stay on hold. Romania is a good example—a diverse market with bond supportive fundamentals. GDP is expanding comfortably on export growth, the central bank is on hold for the medium term and the fiscal deficit is low. The breakeven rate for yield protection on five-year Romanian bonds over a one-year period is 88 basis points (as of 31 Mar 2014). The Romanian central bank has likely finished its easing cycle, but interest rates are expected to stay on hold for at least 12 months in view of the subdued inflation outlook. Consumer prices were reported at 1% year-on-year (February 2014) and are expected to remain below 3% by the end of 2014, the upper end of the central bank’s target.
Fundamental analysis, based on carefully considered economic research, can help to uncover yield curve pricing inefficiencies. Extending along the curve can be income generating, assuming that investors select the right entry point based on individual country research.
DYNAMIC COUNTRY SELECTION THROUGH PERFORMANCE DIFFERENTIATION
More generally, over the years it has been shown that it pays to be active when making country selections. Performance data over the last 10 years show that not all sovereign bond markets win at the same time during a single calendar year period. This dispersion of returns offers opportunities for dynamic country selection.
Rather than abandoning government bonds and removing duration risk, investors should embrace the sovereign markets’ income capabilities and its diversification benefits. Fixed income portfolios that are structured toward more duration risk, rather than credit risk, should provide better downside protection at times of market stress. Investors can engage the alpha levers in higher-yielding fixed income assets, such as currency and credit, opportunistically. Finding the right balance of market beta between duration and credit should help investors to achieve the appropriate income solution.
SUMMARY
- Fixed income solutions have overly focused on the credit markets and overlooked their higher correlation to equities.
- Using the term-premium approach can help investors to source income, increase diversification and protect capital. Extending duration and exploiting steep yield curves are two ways to accomplish these goals.
- Extending duration counters the current thinking of moving closer to cash. There is more dispersion between macroeconomic and interest rate cycles and, therefore, a greater decoupling from the Federal Reserve.
- Investors can source income with minimum levels of volatility and better diversification across both developed and emerging markets. The distinction between these two areas of the market is fading. Focus should be on the quality of income: countries’ ability and willingness to pay.
- Correlations to the US Treasury market are unstable for many developed markets. The correlations of emerging markets (local currency bonds) are consistently lower where higher-yielding opportunities can be captured.
- Yield curves in developed countries are historically steep. Investors can find protection in longer-dated maturities versus the short end of the curve in markets where rates are rising or are expected to remain stable.
- Not all sovereign bond markets will win at the same time. That offers opportunities for dynamic country selection. Rather than abandon duration risk, investors should embrace the sovereign markets’ income capabilities and diversification benefits.
1Barclays and J.P. Morgan. As of 31 Mar 2014.
2 J.P. Morgan and T. Rowe Price. Correlations are calculated on a 52-week rolling basis.
3 J.P. Morgan and T. Rowe Price. Correlations are calculated on a 52-week rolling basis.
4 J.P. Morgan and T. Rowe Price. Correlations are calculated on a 52-week rolling basis
Important Information
This marketing communication is directed at institutional investors only. It is not intended for distribution to retail investors in any jurisdiction. This document, including any statements, information, data and content contained therein and any materials, information, images, links, sounds, graphics or video provided in conjunction with this document (collectively, “Materials”) are being furnished by T. Rowe Price for your general informational purposes only. The Materials are not intended for use by persons in jurisdictions that prohibit or restrict the distribution of the Materials, and in certain countries these Materials are only provided upon specific request.
These Materials are provided for informational purposes only and are not intended to be investment advice or a recommendation to take any particular investment action. They provide opinions and commentary that do not take into account the investment objectives or financial situation of any particular investor or class of investor. The information is based on sources we consider to be reliable. However, we do not guarantee its accuracy. The views contained herein are as of 24 April 2014 and may have changed since that time.
Under no circumstances should the Materials, in whole or in part, be copied, redistributed or shown to any person without consent from T. Rowe Price. The Materials do not constitute a distribution, an offer, an invitation, a recommendation or a solicitation to sell or buy any securities in any jurisdiction. The Materials have not been reviewed by any regulatory authority in any jurisdiction. The Materials do not constitute investment advice and should not be relied upon. Investors should seek independent legal and financial advice, including advice as to tax consequences, before making any investment decision.
Issued by T. Rowe Price International Ltd (“TRPIL”) (ABN 84 104 852 191), Level 50, Governor Phillip Tower, 1 Farrer Place, Suite 50B, Sydney, NSW 2000, Australia. TRPIL is exempt from the requirement to hold an Australian Financial Services license (“AFSL”) in respect of the financial services it provides in Australia. TRPIL is authorised and regulated by the Financial Conduct Authority (the “FCA”) under UK laws, which differ from Australian laws. For Wholesale Clients Use Only.
T. ROWE PRICE, INVEST WITH CONFIDENCE and the Bighorn Sheep design are, collectively and/or apart, trademarks or registered trademarks of T. Rowe Price Group, Inc. in the United States, European Union and other countries. This material is intended for use only in select countries.
