
April 2021 / INVESTMENT INSIGHTS
The Resilience of EM Corporates
EM corporate bonds have had smaller losses and less volatility at times of market turbulence than many other asset classes
Key Insights
- Emerging market corporate bonds have proved remarkably resilient to market shocks in recent years. They have also tended to bounce back relatively quickly after drawdowns.
- On average, this is an investment-grade quality asset class, and issuers’ financial profiles are relatively strong. Defaults in the high-yield segment were modest in 2020, and we expect that to continue in 2021.
- The overall volatility of EM corporates has become more muted over time. A big factor in this has been growth in higher-quality Asia credit, which is now more than 50% of the market.
- For investors looking for higher yield or emerging markets exposure, we believe that EM corporates have a valuable part to play in long-term portfolio allocation.
Some investors view emerging markets in general as risky, and this perception sometimes carries through to emerging market (EM) corporate debt. But the downside experience in this asset class has been remarkably limited.
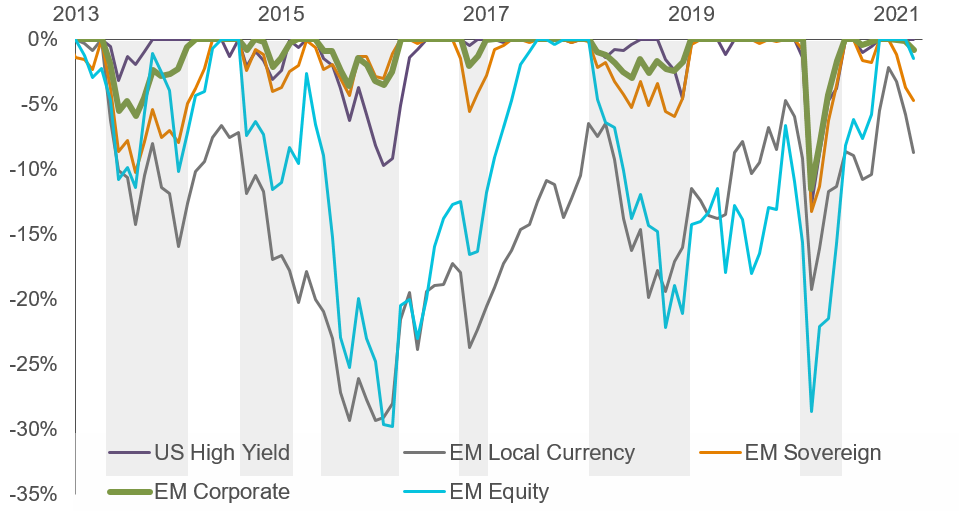
Display 1 shows the losses suffered by different risk assets in falling markets. Hard currency EM corporate debt has consistently outperformed EM sovereign debt, EM local currency debt and EM equities during bear markets.
For example, during the March 2020 Covid-19 shock, the broad EM corporate market ended the month down -11.5% compared with -13.3% for EM sovereigns and -28.6% for EM equities. Over the past year, EM corporates have benefited from their moderate duration (i.e. interest-rate sensitivity) profile amid increased volatility in US Treasury yields.
Display 1: Performance During Market Sell-Offs
Past performance is not a reliable indicator of future performance.
As of 31 March 2021. EM Local Currency—J.P. Morgan GBI-EM Global Diversified; EM Sovereign—J.P. Morgan EMBI Global; EM Corporate—J.P. Morgan CEMBI Broad Diversified; US High Yield—Bloomberg Barclays U.S. Corporate High Yield; EM Equity—MSCI Emerging Markets. Returns are in US dollars.
Source: Bloomberg Index Services Limited, J.P. Morgan, MSCI. See Additional Information.
One reason for the resilience of EM corporates is that, on average, this is an investment-grade quality asset class, and issuers’ financial profiles are relatively strong. For example, recent data from J.P. Morgan put net leverage for EMC investment-grade issuers at 1.9 times earnings, compared with 3.5x for European issuers. EM high-yield net leverage was 3.1x, versus 5.1x for European high yield and 4.6x in the US.
These fundamentals help explain the relatively moderate default rates in 2020—for example 3.5% for EM high yield compared with 6.2% for US high yield. We expect default rates to remain moderate in 2021, and we believe EM corporates’ pattern of resilience is likely to persist in the longer term.
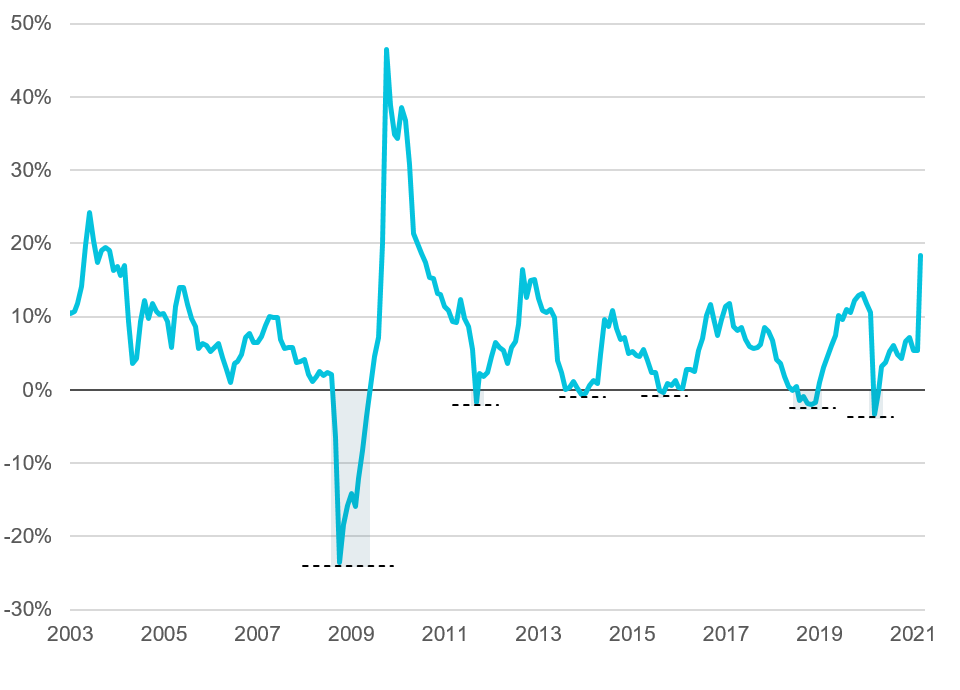
Display 2 shows rolling one-year returns— made up of capital gains/losses and coupon income—for EM corporates since the end of 2002.
Except for double-digit falls during the 2008 global financial crisis, EM corporate losses have been moderate. Given the attractive yields available—typically in the 5% to 7% range—if investors had continued to hold the bonds, the coupon income alone would have allowed them to recoup the capital loss even if bond prices had remained flat. Historically, however, prices have often tended to recover quite swiftly, rewarding investors who bought the dips. As shown in the chart, drawdowns were typically followed by double-digit recoveries the subsequent year.
Display 2: Rolling One-Year Return of EM Corporates
Past performance is not a reliable indicator of future performance.
As of 31 March 2021. Returns of the J.P. Morgan CEMBI Broad Diversified Index, in US dollars. Source: J.P. Morgan. See Additional Information.
The volatility of EM corporates has become more muted over time, and this has to do with the rising average credit quality of EM debt.
Back in the 1990s, this was primarily a high yield asset class, dominated by countries like Argentina, Turkey, Brazil and Russia. Since then, the asset class has transformed. Asia credit has gone from 5% of the market to over 50% of the market. This has deflated the historical volatility of returns.
More than 75% of the Asia credit market is investment grade, and the high-yield opportunity set also has more of a skew towards quality than other regions, with about 57% in the highest BB category, and only about 2% rated CCC or below. This growing Asian component helps explain its resilience during the Covid shock.
In short: emerging markets corporate debt, like any other risk asset, goes through patches of volatility. But in the past decade it has offered investors better compensation for risk than any other EM asset class, and market inefficiencies and information gaps have offered frequent opportunities for active managers to outperform the index.
For investors looking for higher yield or emerging markets exposure, we believe that EM corporates have a valuable part to play in long-term portfolio allocation.
Risks
The following risks are materially relevant to the strategy:
Contingent convertible bond risk— contingent convertible bonds have similar characteristics to convertible bonds with the main exception that their conversion is subject to predetermined conditions referred to as trigger events usually set to capital ratio and which vary from one issue to the other.
Country risk (China)—all investments in China are subject to risks similar to those for other emerging markets investments. In addition, investments that are purchased or held in connection with a QFII licence or the Stock Connect program may be subject to additional risks.
China Interbank Bond Market risk—market volatility and potential lack of liquidity due to low trading volume of certain debt securities in the China Interbank Bond Market may result in prices of certain debt securities traded on such market fluctuating significantly.
Credit risk—a bond or money market security could lose value if the issuer’s financial health deteriorates.
Default risk—the issuers of certain bonds could become unable to make payments on their bonds.
Derivatives risk—derivatives may result in losses that are significantly greater than the cost of the derivative.
Emerging markets risk—emerging markets are less established than developed markets and therefore involve higher risks.
Frontier markets risk—small market nations that are at an earlier stage of economic and political development relative to more mature emerging markets typically have limited investability and liquidity.
High yield bond risk—a bond or debt security rated below BBB by Standard & Poor’s or an equivalent rating, also termed ‘below investment grade’, is generally subject to higher yields but to greater risks too.
Interest rate risk—when interest rates rise, bond values generally fall. This risk is generally greater the longer the maturity of a bond investment and the higher its credit quality.
Liquidity risk—any security could become hard to value or to sell at a desired time and price.
Sector concentration risk—the performance of a strategy that invests a large portion of its assets in a particular economic sector (or, for bond strategies, a particular market segment), will be more strongly affected by events affecting that sector or segment of the fixed income market.
IMPORTANT INFORMATION
This material is being furnished for general informational and/or marketing purposes only. The material does not constitute or undertake to give advice of any nature, including fiduciary investment advice, nor is it intended to serve as the primary basis for an investment decision. Prospective investors are recommended to seek independent legal, financial and tax advice before making any investment decision. T. Rowe Price group of companies including T. Rowe Price Associates, Inc. and/or its affiliates receive revenue from T. Rowe Price investment products and services. Past performance is not a reliable indicator of future performance. The value of an investment and any income from it can go down as well as up. Investors may get back less than the amount invested.
The material does not constitute a distribution, an offer, an invitation, a personal or general recommendation or solicitation to sell or buy any securities in any jurisdiction or to conduct any particular investment activity. The material has not been reviewed by any regulatory authority in any jurisdiction.
Information and opinions presented have been obtained or derived from sources believed to be reliable and current; however, we cannot guarantee the sources' accuracy or completeness. There is no guarantee that any forecasts made will come to pass. The views contained herein are as of the date noted on the material and are subject to change without notice; these views may differ from those of other T. Rowe Price group companies and/or associates. Under no circumstances should the material, in whole or in part, be copied or redistributed without consent from T. Rowe Price.
The material is not intended for use by persons in jurisdictions which prohibit or restrict the distribution of the material and in certain countries the material is provided upon specific request.
It is not intended for distribution retail investors in any jurisdiction.
April 2021 / INVESTMENT INSIGHTS
