
14 June 2021 / FIXED INCOME
Why Credit Investors Need to Manage Duration More Creatively
The importance of duration management in a changing world—and five ways to improve it.
Key Insights
- Duration has been a key driver of credit returns over the past decade, emphasizing the importance of active duration management for credit investors.
- Techniques to creatively manage duration include using structural curve positioning, allocating across regions and currencies, and using credit derivatives.
- Actively managing the total duration of a portfolio by adjusting duration exposure for short periods can also significantly enhance returns.
Many credit investors pay little attention to duration, seeing themselves primarily as bottom‑up investors who specialize in sector and security selection. However, duration has become a major driver of credit total returns over the past decade, making it increasingly difficult to ignore. Managing duration is likely to be a key source of performance for credit investors in the future—giving those who are skilled in it a major potential advantage.
Yet predicting what that future will look like is complicated by the fact that we may be entering a different regime in which the playbook of the past decade no longer works. The 40‑year bull market for bonds, and tailwind for credit returns, is likely exhausted. The massive expansion of the central bank balance sheets in response to the coronavirus pandemic, which have directly and indirectly benefited corporate borrowers and investors, will probably peak this year. Managing duration exposure in the period ahead is going to demand new—and creative—approaches from investors.
The fixed income market has evolved considerably since the global financial crisis (GFC). Vast injections of central bank liquidity have driven down bond yields and encouraged corporate issuers and investors to extend out the curve—bonds of more than 10 years’ maturity now compose more than 28% of the Bloomberg Barclays Global Aggregate Corporate Index (as of December 31, 2020). The average credit investor now holds significantly more duration than in 2009: The duration of the index has increased by around two years, or around 1.4 times, since then.
And while credit strategies have performed very well over that time, much of that performance has been effectively “engineered” by central banks supressing sovereign bond yields. Changes in underlying risk‑free rates—the duration impact—have accounted for the majority of the returns of U.S. and European investment‑grade debt and emerging market (EM) hard currency bonds over the past 10 years and have contributed significantly to the returns of U.S. high yield strategies using index returns as a proxy (Figure 1).
Duration Has Been a Major Driver of Credit Returns Over 10 Years
(Fig. 1) In most strategies, it has exceeded returns from credit impact
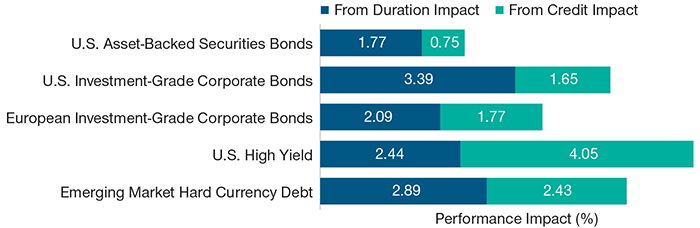
As of March 31, 2021.
Past performance is not a reliable indicator of future performance.
Sources: Bloomberg Barclays U.S. Corporate Bond Index, Bloomberg Barclays U.S. ABS Index, Bloomberg Barclays Euro Corporate Bond Index, Bloomberg Barclays U.S. High Yield Bond Index, and Bloomberg Barclays EM USD Aggregate Corporate Index. Analysis by T. Rowe Price.
The Post‑Pandemic Recovery May Pave the Way for Inflation
The strong influence of duration on credit returns has not been a problem while yields were trending lower. However, with most of the major central banks at their lower bound on interest rates, the downtrend in yields is probably at its end. Indeed, the market has already started to price a return to more normal conditions as vaccination programs ramp up and fiscal stimulus takes the reins from monetary policy. As the lifting of restrictions enables economies to bounce back quickly, anticipation is building about central bank rate hikes and the cessation—or slowing down—of asset purchase programs, posing an eventual risk for credit investors.
Real yields (the yields on Treasury Inflation Protected Securities, or TIPS) which exclude anticipated inflation, may not normally be followed closely by credit investors. However, we believe the direction of real yields is critical for total credit returns because they provide a window on future monetary conditions. Long‑term real yields are determined by structural economic factors such as the pace of productivity growth and demographics, and deviations from the long‑term level are driven by monetary policy. While nominal yields have recently bounced from all‑time lows with expectations for higher inflation, real yields have remained near all‑time lows as the Federal Reserve has maintained a consistently dovish outlook for monetary policy.
Many investors are worried about a repeat of 2013, when market panic over the prospect of the U.S. Federal Reserve tightening policy triggered the “taper tantrum” as government bonds and risk assets sold off dramatically, causing large losses for credit investors (the Bloomberg Barclays Global IG Corporate USD Hedged Index declined 5% in less than two months). Although we believe there is no immediate prospect of rate hikes, and therefore that a repeat of the taper tantrum is unlikely, the enormous amount of monetary stimulus injected into the global economy since the coronavirus swept the world will have to be reduced at some point. Tighter monetary policy, when it comes, should push up real yields closer to the long‑run average rate, which we estimate is currently in the range of 0.0–0.5% (at the end of May, the yield on 10‑year Treasury Inflation‑Protected Securities (TIPS) was -0.86%).
Typically, monetary policy and credit total returns are negatively correlated. Tighter monetary policy typically reduces the attractiveness of credit assets in several ways, such as reducing liquidity, improving the relative returns of risk‑free assets (e.g., U.S. treasuries) versus risky assets, and increasing the cost of corporate borrowing. While corporates can usually absorb higher interest rates driven by higher inflation, higher real yields may squeeze profitability. Figure 2 shows that, over the past 13 years, tighter monetary policy and higher real yields have been associated with poor credit returns, and vice versa.
Falling Real Yields Have Boosted Corporate Debt Returns
(Fig. 2) The change in U.S. 10‑year real yields versus U.S. investment‑grade (IG) debt returns
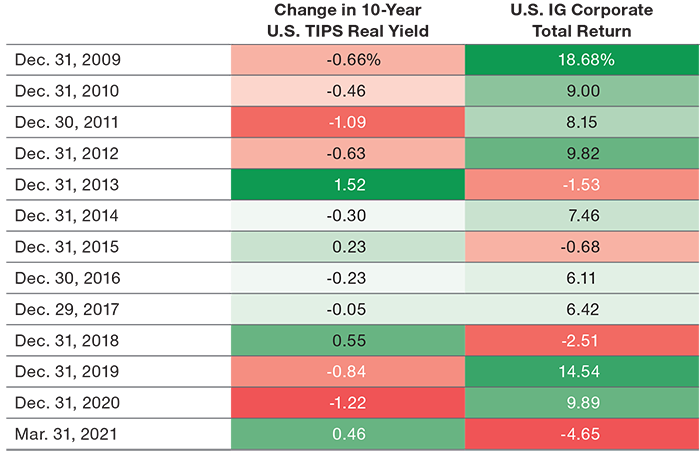
As of March 31, 2021.
Past performance is not a reliable indicator of future performance.
Yields and total return figures are annual to the date shown except for the March 2021 row, which shows the quarterly return.
Source: Bloomberg Finance L.P. Bloomberg Barclays U.S. IG Corporate Index.
An increase in real yields is not the only risk to credit investors. Central banks are concerned about a premature withdrawal of monetary stimulus, preferring instead to maintain easy liquidity conditions until the economic recovery is well advanced. The risk from this approach is higher expected inflation and interest rate volatility. So even if the Fed stays dovish and the market does not price a significant tightening of policy in the next few years, the long end of the Treasury curve should steepen in order to price in a greater term premium that captures inflation and Fed policy uncertainty. At present, in spite of very high current inflation, the market is forecasting that longer term inflation will be only slight above the Fed’s 2% target. If the recent price gains do not cool, it will cause a headache for bond investors.
As interest rates fell over the past 40 years, corporate investors were rewarded by the decline in the risk‑free rate plus the additional credit spread. Holding corporate debt has often helped to mitigate the impact of periodic sovereign yield spikes as credit duration was lower and spreads were able to compress, cushioning the blow from rising risk‑free rates and demonstrating a negative correlation. However, in times when market stress coincides with significant Treasury yield moves, the correlation may flip to positive as the market’s rates concerns translate into credit concerns (Figure 3).
Credit/Rate Correlations Tend to Mean‑Revert Over Time
(Fig. 3) Trailing six‑month correlation between IG option‑adjusted spreads and 10‑year U.S. Treasury yields
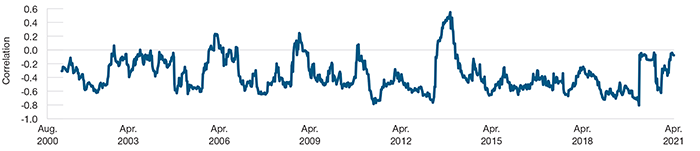
As of April 30, 2021.
Source: Bloomberg Finance L.P. Analysis by T. Rowe Price.
The correlation has been mean‑reverting, but what if inflation persists and gives rise to additional uncertainty over the Fed’s policy reaction? Could the correlation remain near zero where it is today, or possibly move into positive territory? This is not our current base case, but it is a risk to be aware of, particularly with regards to portfolio construction. Furthermore, we believe the diversification impact of corporate debt has diminished over the past decade as U.S. and European investment‑grade indices have become more sensitive to interest rate rises (Figure 4). In my view, the current combination of very low sovereign yields (greater interest rate risk), tight credit spreads (less cushion), and less diversification benefits puts credit bondholders in a vulnerable position. This suggests a need for greater duration flexibility.
U.S. and European IG Indices Have Become More Sensitive to Rate Rises
(Fig. 4) Bondholders are in a vulnerable position

As of December 31, 2020.
Shows the hypothetical performance impact from different potential increases in interest rates based on index composition as of each date. Subject to change.
Sources: Analysis is based on the Bloomberg Barclays Euro Corporate Bond Index and Bloomberg Barclays U.S. Corporate Bond Index. Bloomberg PORT (see Additional Disclosures). Analysis byT. Rowe Price. Analysis based on the Bloomberg PORT full valuation model. The model assumes a parallel Treasury curve movement. Stress testing is hypothetical and for illustrative purposes only, and figures do not represent actual investment results. Actual investment results may differ materially.

IMPORTANT INFORMATION
This material is being furnished for general informational purposes only. The material does not constitute or undertake to give advice of any nature, including fiduciary investment advice, and prospective investors are recommended to seek independent legal, financial and tax advice before making any investment decision. T. Rowe Price group of companies including T. Rowe Price Associates, Inc. and/or its affiliates receive revenue from T. Rowe Price investment products and services. Past performance is not a reliable indicator of future performance. The value of an investment and any income from it can go down as well as up. Investors may get back less than the amount invested.
The material does not constitute a distribution, an offer, an invitation, a personal or general recommendation or solicitation to sell or buy any securities in any jurisdiction or to conduct any particular investment activity. The material has not been reviewed by any regulatory authority in any jurisdiction.
Information and opinions presented have been obtained or derived from sources believed to be reliable and current; however, we cannot guarantee the sources' accuracy or completeness. There is no guarantee that any forecasts made will come to pass. The views contained herein are as of the date noted on the material and are subject to change without notice; these views may differ from those of other T. Rowe Price group companies and/or associates. Under no circumstances should the material, in whole or in part, be copied or redistributed without consent from T. Rowe Price.
The material is not intended for use by persons in jurisdictions which prohibit or restrict the distribution of the material and in certain countries the material is provided upon specific request.
It is not intended for distribution to retail investors in any jurisdiction.
USA—Issued in the USA by T. Rowe Price Associates, Inc., 100 East Pratt Street, Baltimore, MD, 21202, which is regulated by the U.S. Securities and Exchange Commission. For Institutional Investors only.
© 2023 T. Rowe Price. All rights reserved. T. ROWE PRICE, INVEST WITH CONFIDENCE, and the bighorn sheep design are, collectively and/or apart, trademarks or registered trademarks of T. Rowe Price Group, Inc.

Kenneth Orchard is head of International Fixed Income. He is portfolio manager for the Global Multi-Sector Bond and Diversified Income Bond Strategies and co-portfolio manager for the International Bond Strategy. Kenneth is a member of the Fixed Income Steering Committee, cochair of the fixed income Sector Strategy Advisory Group, and a member of the European and UK Asset Allocation Committees. He is a vice president of T. Rowe Price Group, Inc., and T. Rowe Price International Ltd.
