
22 July 2021 / INVESTMENT APPROACH
T. Rowe Price's Strategic Investing Approach Has Benefited Our Results
Discipline has brought long‑term rewards for clients.
Key Insights
- Research has shown that active manager performance can be cyclical and that some specific manager characteristics may contribute to long‑term success.
- We reviewed 18 composites within our institutional diversified active U.S. equity strategies to quantify the value added by our strategic investing approach.
- We found that the vast majority of composites within our strategies generated positive average excess returns, net of fees, over their benchmarks across multiple time periods.1
- We credit our success to our efforts to go beyond the numbers and get ahead of change, which we believe leads to better decisions and prudent risk management.
Most sophisticated investors are aware of the pitfalls of overreacting to short‑term market trends—a habit that can lead to disappointing long‑term returns. Capital markets are volatile, and investors who rush to sell or buy assets based solely on their recent performance may find they’ve taken on more risk than they expected.
(Fig. 1) Relative Performance Can Be Volatile Over the Short Run
Percentage of managers in eVestment Alliance database outperforming their category andstyle benchmarks (net of fees)

Rolling one‑year periods ended December 31, 2020
Sources: Zephyr StyleADVISOR and eVestment Alliance LLC. Data analysis by T. Rowe Price. Created with Zephyr StyleADVISOR.
Relative manager results can vary widely over short‑term periods due to market trends or other factors. The result is a high degree of volatility or statistical “noise.”
The same principle applies to actively managed investments—those that seek to add value for clients through security selection, sector rotation, factor weighting, or other techniques. Like the markets themselves, relative performance tends to be volatile. Evaluating managers based on quarterly or even annual results can be difficult and potentially misleading. Successful strategies often take time to bear fruit, and contrarian bets are rarely rewarded immediately. Attractive growth opportunities may be prospective, not immediate, and undervalued companies may remain undervalued for months or years.
The academic literature is clear about the obvious problem that the “average” active manager faces in seeking to generate excess returns, especially net of fees and other costs. Over time, the positive and negative excess returns of active managers as a group have tended to balance out, leaving fees and other costs as a net drag on relative performance.
However, while we recognize the virtues of passive index strategies—and employ indexed components in some of our asset allocation strategies—we do believe strongly that a skilled strategic investing approach has the potential to add value for clients over longer‑term time horizons.
Evaluating manager performance requires investors and/or their financial advisors to distinguish between the signal and the noise—that is, to see past the many factors that may generate volatility in relative returns and paint a distorted short‑term picture (either positive or negative) of manager skill.
(Fig. 2) Active Managers May Lead in Bear Markets, Lag in Bull Markets
Manager performance vs. benchmark performance (net of fees)

Rolling one‑year periods ended December 31, 2020
Sources: Zephyr StyleADVISOR, eVestment Alliance LLC, and Russell (see Additional Disclosures). Data analysis by T. Rowe Price. Created with Zephyr StyleADVISOR.
Active managers, as a group, have tended to outperform in bear markets by limiting downside volatility. Market performance has been inverted in the above charts to make that point clearer.
Relative Performance Is Noisy in the Short Term
The first point to recognize is that relative performance—equity performance, in particular—can be extremely volatile over the short run, as seen by the trends in manager rankings in four key size/style categories in the eVestment Alliance database over the past two decades (Figure 1).2
While aggregate relative outperformance will tend to equal aggregate underperformance over time, that may mean a relatively small number of managers outperforming a benchmark by wide margins while a large majority of managers slightly underperform—or vice versa. This balance can reverse very quickly. When return dispersion is low, manager and benchmark performance may differ by only a handful of basis points, further magnifying the volatility of relative performance rankings when return differentials widen again.
Times When Active Outperforms
Within that short‑term noise, more predictable—or at least more cyclical— patterns also may be found. Research has identified several broad market environments in which active equity managers, in general, may be more likely to outperform.
These include:
- Bear markets: Research suggests that active U.S. equity managers have had a relatively higher chance of outperforming when market performance is poor (Figure 2). One study has argued that this effect persisted even after differences in exposure to market risk (i.e., beta) were taken into account, suggesting that active managers have provided a certain amount of relative performance improvement in more volatile markets.3
- High return dispersion: Historically, when the correlation of returns within a benchmark was low, active managers as a whole may have had more opportunities to add value through security selection or sector rotation (Figure 3). However, this trend did not hold amid the market disruptions associated with the COVID‑19 pandemic. It remains to be seen whether the historical pattern will reassert itself if dispersion remains elevated going forward.
- Volatile markets: Active U.S. equity managers as a group have been somewhat more likely to outperform in periods when market returns have been more variable.
(Fig. 3) When Return Dispersion Is High, Active Managers May Have More Opportunities to Add Value
Active manager performance vs. return dispersion (net of fees)

Rolling one‑year periods ended December 31, 2020.
Sources: Zephyr StyleADVISOR, eVestment Alliance LLC, and Russell (see Additional Disclosures). Data analysis by T. Rowe Price. Created with Zephyr StyleADVISOR.
Over longer time horizons, periods of extreme relative underperformance or outperformance have tended to revert toward the mean, smoothing out some of the noise that dominates quarterly and annual results. This tendency is highlighted in Figure 4, which shows relative manager performance in the same four eVestment Alliance categories as in Figure 1 but across progressively longer rolling time periods.4 The influence of longer‑term cyclical factors is now more visible.
Study of T. Rowe Price Diversified U.S. Equity Strategies
Looking at broad historical trends can be enlightening when it comes to evaluating the performance of active managers as a group. But it doesn’t tell us much about the question investors are probably most interested in: Can my manager generate positive excess returns after management fees and other costs?
For investors with longer time horizons— such as pension plan sponsors—we believe this question is best answered across multiyear periods (or even multiple market cycles) to filter out the short‑term relative volatility described above. However, the standard 1‑, 3‑, 5‑, and 10‑year return histories typically shown to clients and prospective investors—and used in many industry performance studies—provide only snapshots of past performance as of a current date. To gain a clearer picture of manager skill, we believe more intense investigation is required.
(Fig. 4) Relative Performance Has Been More Stable Over Longer Time Horizons
Percentage of managers in the eVestment Alliance database outperforming their benchmarks (net of fees)

Rolling periods ended December 31, 2020
These charts show how relative performance has tended to offer a more consistent picture as time periods extend, smoothing out some of the noise that dominates one‑year periods.
Sources: Zephyr StyleADVISOR and eVestment Alliance LLC. Data analysis by T. Rowe Price. Created with ZephyrStyleADVISOR.
As equity managers, we are primarily interested in whether our own investment process—which emphasizes bottom‑up fundamental analysis, in‑depth research coverage, and collaboration across size and style categories—has created long‑term value for our clients. For a better understanding of this issue, we conducted a rigorous study of the performance of T. Rowe Price’s institutional diversified U.S. equity composites over the 20 years ended December 31, 2020 (or since inception for composites that lacked a full 20‑year track record).
Our study included 18 of the 24 composites within the institutional diversified U.S. equity strategies currently advised by T. Rowe Price. In instances where a portfolio manager managed multiple strategies in the same sub‑asset class and/or style (e.g., U.S. small‑cap growth), we used only the composite with the highest assets under management to avoid double counting.5 The composites included in our study represented approximately 79% of total U.S. equity assets in the domestic and global equity composites advised by the firm as of December 31, 2020. The designated benchmarks for each composite, as well as the dates of their inclusion in the study, are shown in Figure 5.
(Fig. 5) The Performance Study Universe
T. Rowe Price composites, benchmarks, and inclusion dates
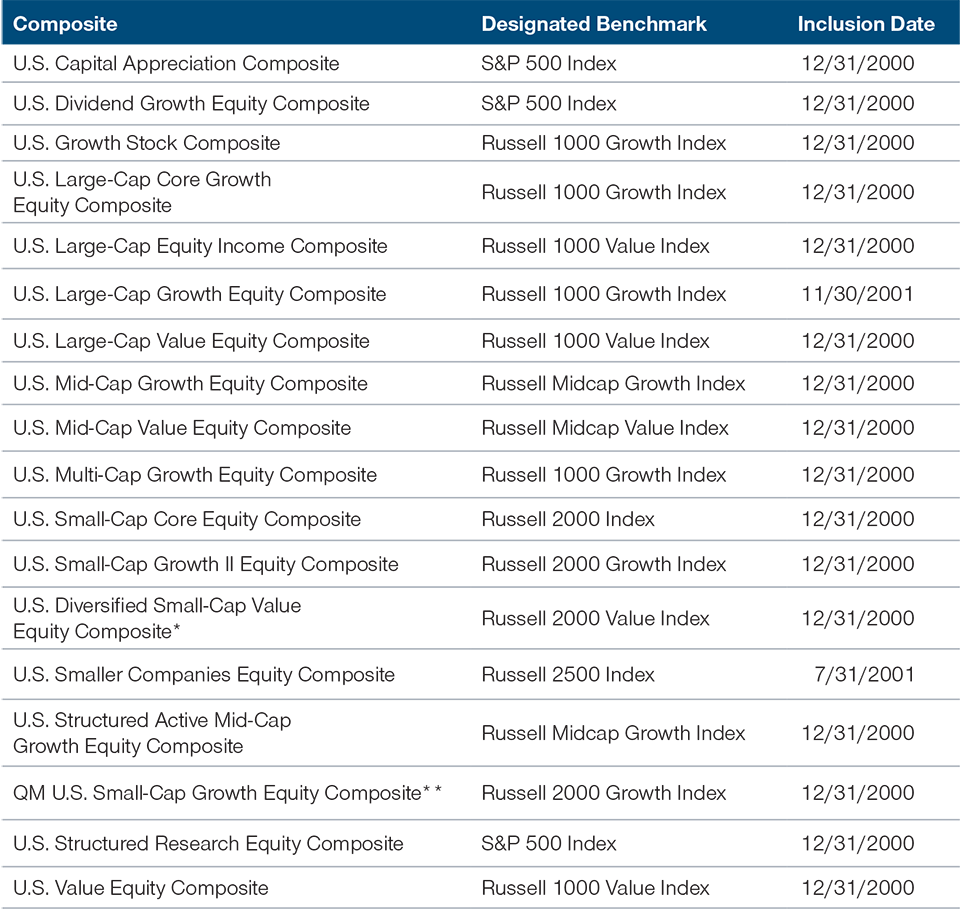
*Formerly the U.S. Small‑Cap Value IV Equity Composite.
**Formerly the U.S. Structured Active Small‑Cap Growth Equity Composite.
†Prior to March 1, 2021, the name of the U.S. All-Cap Opportunities Equity Composite was the U.S. Multi-Cap Growth Equity Composite.
†† The formal benchmark for the U.S. All-Cap Opportunities Equity Composite was changed to the Russell 3000 Index on March 1, 2021. However, the active performance results cited in this study were based on the Russell 1000 Growth Index.
Sources: T. Rowe Price, Russell, and Standard & Poor’s (see Additional Disclosures).
For illustrative, informational purposes only. Not all strategies/structures shown are available in all jurisdictions from T. Rowe Price.
For each composite included in the study, we examined performance over rolling 1‑, 3‑, 5‑, and 10‑year periods (rolled monthly) from December 31, 2000, through December 31, 2020. We then calculated excess returns (positive or negative) for each composite for each time period relative to the appropriate benchmark— the designated style benchmark used in T. Rowe Price performance reports and disclosures. Composite returns were calculated net of fees, based on the highest breakpoint fee for T. Rowe Price institutional U.S. equity clients.
For each composite, we calculated active success rates (the percentage of periods in which the composite outperformed its benchmark) and average returns relative to that benchmark for each time frame (i.e., over all rolling 1‑, 3‑, 5‑, and 10‑year periods).6 The results are displayed in Figures 6 and 7.

IMPORTANT INFORMATION
This material is being furnished for general informational purposes only. The material does not constitute or undertake to give advice of any nature, including fiduciary investment advice, and prospective investors are recommended to seek independent legal, financial and tax advice before making any investment decision. T. Rowe Price group of companies including T. Rowe Price Associates, Inc. and/or its affiliates receive revenue from T. Rowe Price investment products and services. Past performance is not a reliable indicator of future performance. The value of an investment and any income from it can go down as well as up. Investors may get back less than the amount invested.
The material does not constitute a distribution, an offer, an invitation, a personal or general recommendation or solicitation to sell or buy any securities in any jurisdiction or to conduct any particular investment activity. The material has not been reviewed by any regulatory authority in any jurisdiction.
Information and opinions presented have been obtained or derived from sources believed to be reliable and current; however, we cannot guarantee the sources' accuracy or completeness. There is no guarantee that any forecasts made will come to pass. The views contained herein are as of the date noted on the material and are subject to change without notice; these views may differ from those of other T. Rowe Price group companies and/or associates. Under no circumstances should the material, in whole or in part, be copied or redistributed without consent from T. Rowe Price.
The material is not intended for use by persons in jurisdictions which prohibit or restrict the distribution of the material and in certain countries the material is provided upon specific request.
It is not intended for distribution to retail investors in any jurisdiction.
USA—Issued in the USA by T. Rowe Price Associates, Inc., 100 East Pratt Street, Baltimore, MD, 21202, which is regulated by the U.S. Securities and Exchange Commission. For Institutional Investors only.
© 2023 T. Rowe Price. All rights reserved. T. ROWE PRICE, INVEST WITH CONFIDENCE, and the bighorn sheep design are, collectively and/or apart, trademarks or registered trademarks of T. Rowe Price Group, Inc.
November 2021 / U.S. EQUITIES