
April 2022 / ASSET ALLOCATION VIEWPOINT
Parallels to the 1973 Market Shocks May Be Imprecise
Recession in U.S. appears unlikely amid reopening economy
Key Insights
- We analyzed seven geopolitical and commodity shocks from the early 1970s to the present.
- Our scenario analysis shows that these shocks did not typically hurt stocks, with the exception of the oil and agriculture shock of 1973.
- While there are similarities between the current environment and 1973, we think the reopening economic momentum will keep the U.S. out of recession.
Will Russia’s invasion of Ukraine and the spike in commodities prices cause the U.S. stock market to meaningfully underperform bonds? To add historical perspective to this question, we analyzed asset class returns and macroeconomic trends following seven geopolitical and commodity shocks from the early 1970s to the present. Our scenario analysis revealed that geopolitical and commodity shocks have not typically triggered equity underperformance. Of our seven scenarios, the dual shock of 1973 is the only worrisome analogy. Over the 12 months following the oil price spike of October 1973, stocks underperformed bonds1 by 30%.
Relative Returns of Stocks Were Mostly Resilient
(Fig. 1) Major external shocks* since the 1970s

Past performance is not a reliable indicator of future performance.
*Analysis excludes smaller external shocks
Stocks represented by the S&P 500 Index, January 1972–February 2022; bonds represented by the SBBI Intermediate Government Bond, January 1972–December 1976 and Bloomberg U.S. Aggregate Bond Index, January 1977–February 2022.
Source: Analysis by T. Rowe Price.
A Shock on Top of a Shock
Are we facing a 1973‑like scenario? Like now, the 1973 scenario includes both oil and agricultural commodities—a shock on top of a shock. In the first shock, food prices skyrocketed on worldwide grain production issues. Then OPEC instituted the oil embargo that created the second shock. Inflation was already running high, and the oil crisis exacerbated it.
There are many differences between then and now, but both periods are a reminder that oil and commodity shocks push inflation higher and can wreck growth. The relationship between oil shocks and subsequent economic growth is less direct than for inflation, and the effect is always conflated with other variables. But there are three ways that inflation can lead to recession:
- Higher gas prices, which are a tax on the consumer.
- Inflation leading to wage growth, which eats into corporate profit margins.
- And, of course, inflation can force the Federal Reserve (Fed) to raise rates too aggressively.
What’s the Recession Risk?
If we want to compare the current situation with that of 1973, the most important question involves growth. What’s the recession risk? In our view, whether the oil shock is the direct cause does not matter that much.
Rising rates have not caused stocks to underperform over the last 30 years because the Fed hiked during expansions. But if the Fed really needs to fight inflation, which has not been a real issue for decades, the “Fed put”—easing monetary policy when equities fall meaningfully—may disappear, or a more severe downturn may be required for the Fed to come to the market’s rescue.
That is exactly what happened in 1973. The Fed was largely behind the curve, as some may say it is now. It raised the benchmark federal funds rate from 5.5% in December 1972 to 13% in June 1974—and then lowered it to 4.75% by March 1976! More importantly, the Fed kept hiking well into the recession, exacerbating the severity of the slowdown.
Stocks Lagged After 1973’s Dual Shocks
(Fig. 2) Relative returns of equities vs. bonds* after shocks
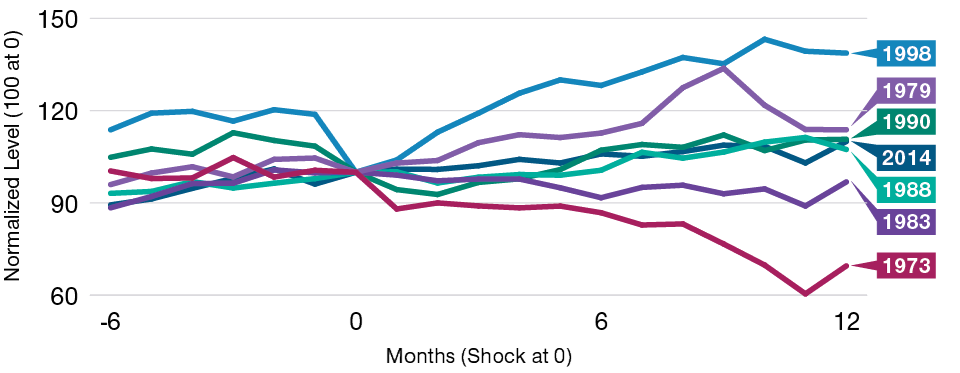
Past performance is not a reliable indicator of future performance.
*See Figure 1.
Source: Data analysis by T. Rowe Price.
Positive Economic Forces of Reopening to Provide Support
Currently, growth is decelerating, but we are not as late in the economic cycle and we do not face as many disruptions as we did in 1973. Also, in 1973:
- The U.S. was a net importer of oil. Now the U.S. is (albeit barely) a net exporter.
- Consumption was 50% more dependent on petroleum products than it is now.
- The dollar was devalued. It remains strong now.
Following the oil shock of 1973, real gross domestic product (GDP) fell by just over 1.0% in the next 12 months. And the recession lasted two years. We do not think that is a realistic scenario for the current environment, given pristine consumer and corporate balance sheets as well as the inescapable positive economic forces of the reopening. However, across almost all the historical shocks that we examined, inflation remained extremely elevated over the next 12 months.
Implications for Portfolio Positioning
What does this mean for positioning, looking forward six to 18 months? In our asset allocation portfolios, we are tactically positioned for rising rates, and we are overweight short‑term Treasury inflation‑protected securities (TIPS), bank loans, and value stocks, all of which could do well in an inflationary environment. Meanwhile, we remain slightly underweight to stocks, given elevated valuations and geopolitical and monetary policy uncertainty.
IMPORTANT INFORMATION
This material is being furnished for general informational and/or marketing purposes only. The material does not constitute or undertake to give advice of any nature, including fiduciary investment advice, nor is it intended to serve as the primary basis for an investment decision. Prospective investors are recommended to seek independent legal, financial and tax advice before making any investment decision. T. Rowe Price group of companies including T. Rowe Price Associates, Inc. and/or its affiliates receive revenue from T. Rowe Price investment products and services. Past performance is not a reliable indicator of future performance. The value of an investment and any income from it can go down as well as up. Investors may get back less than the amount invested.
The material does not constitute a distribution, an offer, an invitation, a personal or general recommendation or solicitation to sell or buy any securities in any jurisdiction or to conduct any particular investment activity. The material has not been reviewed by any regulatory authority in any jurisdiction.
Information and opinions presented have been obtained or derived from sources believed to be reliable and current; however, we cannot guarantee the sources' accuracy or completeness. There is no guarantee that any forecasts made will come to pass. The views contained herein are as of the date noted on the material and are subject to change without notice; these views may differ from those of other T. Rowe Price group companies and/or associates. Under no circumstances should the material, in whole or in part, be copied or redistributed without consent from T. Rowe Price.
The material is not intended for use by persons in jurisdictions which prohibit or restrict the distribution of the material and in certain countries the material is provided upon specific request.
It is not intended for distribution to retail investors in any jurisdiction.
