

Choose your location
Norway
English
Belgium
Denmark
Estonia
Finland
France
Iceland
Ireland
Latvia
Lithuania
Luxembourg
Netherlands
Norway
Portugal
Sweden
United Kingdom
 17 August 2026
Weekly Market Recap
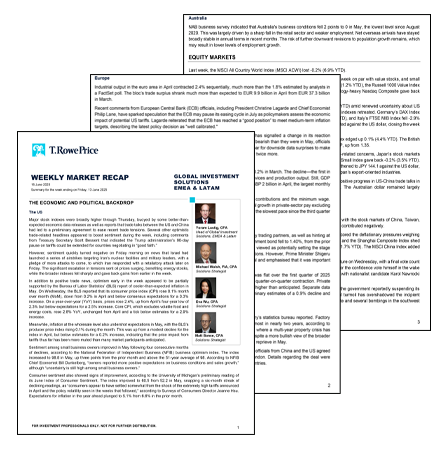
Our Global Investment Solutions team summarise the week's key market events and developments — with insights to support your client conversations and decision-making.
Key resources
Weekly Market article


Weekly Market data

Economic and political backdrop
The UK
The Bank of England’s Chief Economist Huw Pill said that stronger-than-expected GDP figures reinforced the case for higher borrowing costs to return inflation to target. UK government bond yields had already moved higher early in the week, with the 10-year gilt yield moving above 5%, as investors continued to assess the interaction between inflation risks, fiscal policy, and prospective tax increases.
The US
Inflation data were a major focus during the week. On Wednesday, the Bureau of Labor Statistics (BLS) reported that its consumer price index (CPI) rose 0.1% in July and 3.4% over the prior 12 months, in line with consensus estimates. Core CPI—which excludes food and energy costs—increased 0.2% month over month and 2.5% year over year, also in line with estimates. July marked the second consecutive month in which both headline and core CPI inflation eased on a year-over-year basis, with both measures declining 0.1 percentage point from June.
Thursday’s producer price data provided some additional relief. Core producer prices rose 0.2% in July, below consensus estimates for a 0.3% increase and down from June’s revised reading of 0.4%. On a year-over-year basis, headline producer prices rose 4.7%, also below estimates and down from June’s reading of 5.5%. The softer inflation reports helped reduce expectations for near-term monetary policy tightening: By Friday afternoon, futures markets were pricing a roughly 32% chance of a rate hike at the Federal Reserve’s (Fed’s) September meeting, down from around 52% earlier in the week, according to the CME FedWatch Tool.
Fed officials nevertheless continued to emphasize inflation risks. Cleveland Fed President Beth Hammack reiterated her view that policymakers should raise rates to prevent the economy from overheating, while Richmond Fed President Tom Barkin said it remained an open question whether additional tightening would be necessary to bring inflation back to target.
Data from the Census Bureau showed that US retail sales fell 0.6% month over month in July, missing estimates for a 0.1% increase and down from June’s 0.2% rise. This was the largest monthly drop since May 2025. Control group sales—which exclude several categories and feed into the gross domestic product (GDP) calculation—fell 0.4% from the prior month.
The University of Michigan reported that a preliminary reading of its August Index of Consumer Sentiment came in at 51, dropping 4.2 points from July and snapping a two-month streak of increases. The decline was driven by a sharp drop in short- and long-run expectations for business conditions. Expectations for inflation in the year ahead ticked up to 4.3%, remaining well above the 3.4% figure reported in February prior to the Iran conflict.
Europe
European gas and fuel costs rose higher, causing disruption in industrial logistics. Energy market developments remained an important backdrop throughout the week. Oil prices rebounded sharply early in the period as hopes for an agreement to reopen the Strait of Hormuz faded, although energy shares later gave back some of their gains.
Elsewhere, extreme heat disrupted French nuclear generation, temporarily reducing available capacity and highlighting the risk that weather-related supply constraints could add to regional energy price volatility.
The Sentix Economic Index measure of eurozone investor confidence returned to positive territory in August and posted its fourth consecutive monthly increase, adding to evidence that the regional economy has remained relatively resilient despite elevated energy prices and the conflict in the Middle East.
Country-level indicators were more mixed. The Bank of France estimated that the French economy would grow 0.2% in the third quarter based on its latest survey of businesses. Swiss second-quarter GDP beat forecasts with its highest quarterly growth rate in five years at 1.5%. Meanwhile, low water levels on the Rhine began to disrupt industrial activity in Germany, adding another potential supply-side headwind.
China
China’s consumer and producer inflation softened by more than expected in July as the impact of the oil price shock triggered by the US-Iran war appeared to recede. The CPI rose 0.5% from a year earlier in July, declining from 1% in June and falling to a six-month low. According to the National Bureau of Statistics, the deceleration was primarily driven by slowing gasoline fuel price increases, while food prices also weakened. Core consumer inflation, which strips out both food and energy costs, also edged lower to 0.9%.
Meanwhile, producer price growth eased to 3.5% year over year from 4.1% in the previous month. This was its first moderation since March, when producer inflation turned positive after 41 straight months of deflation.
Authorities in Beijing relaxed homebuying rules for non-residents, adding to recent efforts from various major cities to reverse a prolonged property market slump. Nonlocal residents will now be eligible to purchase homes within the city’s Fifth Ring Road—a major expressway around the central districts—if they have made social security contributions or income tax payments for one year, down from two years previously. The municipal government also raised the maximum limits for eligible buyers taking housing provident fund loans. Beijing’s measures were similar to easing actions announced by Shanghai in February and supported shares of real estate developers.
Japan
The Bloomberg news agency, citing unnamed sources familiar with the matter, suggested that the Takaichi government is supportive of a near-term Bank of Japan (BoJ) rate hike, as it acknowledges that the weakness of the yen is feeding into inflationary pressure, leaving households to grapple with increasing living costs. Japan’s government stated that it believes specific monetary policy measures, including interest rate hikes, should be left to the BoJ, but the central bank should work closely with the government to achieve its 2% inflation target in a stable manner. The Summary of Opinions at the BoJ’s July monetary policy meeting revealed that policymakers see room to keep raising rates, with several board members noting upside risks to inflation and one board member suggesting that the pace of hikes could accelerate.
Among the week’s economic data releases, Japan’s corporate goods price index rose 7.2% year over year in July, below estimates for 7.4% and June’s revised 7.3%. While July’s reading pointed to a minor cooling in cost pressures, it still showed producer prices rising near the fastest pace in over three years.
Separately, the Reuters Tankan Index for Japanese manufacturers increased to +18 in August from +13 in July, driven higher by improving confidence among manufacturers benefiting from robust semiconductor demand.
Australia
The Reserve Bank of Australia (RBA) left its cash rate unchanged at 4.35%, in line with market consensus. The RBA observed that the impact of the Middle East conflict on inflation has been "less than expected", economic growth is slowing "as expected", and that labour market conditions have "eased by a little more than expected". Australia business conditions edged 1 point higher, remaining slightly below its long-run average. New housing loan commitments, excluding refinancing, in Australia fell 5.2% quarter over quarter in value terms in Q2, with tax changes for housing investors announced in the Federal Budget on May 12 weighing on loan demand in the second half of the quarter.
Canada
The dominant theme remains the August 19 deadline, after which the US is set to impose 50% tariffs on approximately $20 billion of Canadian goods (plastics, clothing, electrical equipment, and others). Talks continued through the week with Canadian negotiators camped in Washington, but as of Friday evening, Canada's chief negotiator Janice Charette told a government advisory group there is still "a significant amount of work to do."
Markets
Equity markets
Last week, the MSCI All Country World Index (MSCI ACWI) rose 0.7% (15.7% YTD).
Major US stock indexes finished the week mixed as investors weighed easing concerns about inflation and Fed policy and some favourable artificial intelligence (AI)-related earnings news against rising oil prices, continued uncertainty surrounding the Strait of Hormuz, and weaker-than-expected consumer data. The S&P 500 Index finished 0.4% higher (14.5% YTD). The technology-heavy Nasdaq Composite rose 0.2% (15.4% YTD). Small caps tended to outperform with large caps for the week overall. The Russell 1000 Growth Index returned 0.5% (6.2% YTD), the Russell Value Index 0.4% (23.9% YTD), and the Russell 2000 Index 1.1% (24.6% YTD).
In Europe, the MSCI Europe ex-UK Index ended the week flat (13.6% YTD). Investors weighed resilient regional economic data and generally solid corporate earnings against persistent geopolitical uncertainty surrounding the US-Iran conflict and the Strait of Hormuz. Major stock indices were mixed. Germany’s DAX Index climbed 0.5% (8.0% YTD) but France’s CAC 40 Index fell -0.9% (8.9% YTD). Italy’s FTSE MIB Index was also down -0.2% (22.9% YTD). Switzerland’s SMI fell -1.1% (11.6% YTD). The euro was unchanged against the US dollar, closing the week at USD 1.16 for EUR.
The FTSE 100 Index in the UK was down -1.1% (10.9% YTD), while the FTSE 250 Index rose marginally, by 0.2% (13.1% YTD). The British pound was flat for the week against the US dollar, closing at USD 1.35 for GBP.
Japan’s stock markets registered substantial gains over the week. Strong technology earnings, led by memory companies, were a key driver of market momentum. Japan’s export-oriented industries were boosted by the yen’s retreat, despite authorities’ recent currency interventions. Bank shares benefited from reports signalling that an interest rate hike by the BoJ could be imminent. The TOPIX Index rose 3.0% (24.6% YTD), and the TOPIX Small Index added 3.1% (22.1% YTD).
The yen weakened to JPY 159 against the US dollar on Friday, giving back more of the gains that followed the prior week’s currency interventions. The yield on the 10-year Japanese government bond rose to 2.87% from the prior week’s 2.79%, as oil price volatility exacerbated inflation concerns and added to the case for further BoJ policy tightening.
The ASX 200 Index dropped 1.5% this week (6.9% YTD) due to below-expectation bank earnings and the decrease in new housing loan commitments. Australian government bond yields remained largely unchanged. Australian dollar also stayed stable versus the US dollar.
In Canada, the S&P/TSX Composite rose 1.0% (17.4% YTD).
Emerging markets and other markets
The MSCI Emerging Markets Index had a strong week, up by 2.7% (22.9% YTD). The South Korean and Taiwanese markets were strongly positive, while the Brazilian, Indian and Chinese markets contributed negatively.
China equities were choppy but ultimately ended the week lower, with Hong Kong shares underperforming. Markets started the week well, led by strength from the consumer and property segments, but the momentum faded amid losses for precious metals stocks. That said, optical component companies fared well on the back of strong forecasts from US AI firms. The onshore CSI 300 Index, the main onshore benchmark, declined by -0.6% (2.4% YTD), while the Shanghai Composite Index fell -0.3% (0.5% YTD). The MSCI China Index, which primarily comprises offshore-listed stocks, fared worst, falling by -3.1% (-8.3% YTD).
Index compiler Hang Seng Indexes Company (Hang Seng Indexes) unveiled plans to expand Hong Kong’s main technology stock gauge, the Hang Seng Tech Index, to include more companies in the AI and robotics sectors. The number of constituents in the revamped benchmark will increase from 30 to 50, with 10 companies selected based on sales growth instead of market capitalization to enable the inclusion of smaller, higher-growth businesses. Hang Seng Indexes hopes to announce the final revisions by the end of September 2026, with the changes to be implemented in the December 2026 index rebalancing. Currently, the index tracks the 30 largest technology companies listed in Hong Kong.
Brazilian markets faced a volatile week as investors balanced encouraging inflation news against rising concerns about the October presidential election and the government’s fiscal outlook. Consumer inflation slowed to 4.44% in July from 4.64% in June, bringing it back within the central bank’s target range after two months above it. However, minutes from the Central Bank of Brazil indicated that policymakers still view underlying inflation as being supported by relatively strong demand and believe interest rates need to remain restrictive as the economy cools. The central bank cut its benchmark Selic rate by 25 basis points (0.25 percentage points) earlier this month to 14% but has left the pace of additional easing open. Official central-bank materials similarly emphasize that bringing inflation sustainably back to target depends in part on slower demand and well-anchored inflation expectations.
Politics and fiscal policy nevertheless became the bigger driver of markets. Polling showing President Luiz Inácio Lula da Silva with a strong lead ahead of October’s election revived questions among investors about whether the next government will make the budget adjustments needed to stabilize Brazil’s rising public debt. Some global investors reduced exposure to Brazilian stocks, bonds, and the real as election risk became more prominent. Congress sought to address some of those concerns by approving new limits on the growth of certain mandatory expenditures. The government estimates the measures could reduce next year’s spending by about BRL 10 billion, while keeping spending growth within Brazil’s existing fiscal framework. The move was viewed as a step toward greater budget discipline, although investors remain focused on whether it will be sufficient to stabilize the country’s debt burden over time.
Argentina’s inflation picture remained a central focus this week. Consumer prices rose 2.1% in July, up from 1.9% in June and slightly above expectations, marking the first monthly acceleration after three straight months of slower readings. Annual inflation also edged up to 33.8% from 33.5%, although that remains far below the levels seen earlier in President Javier Milei’s term. The increase was driven in part by seasonal pressures, including higher recreation and holiday-related costs, while core inflation remained somewhat lower. The data suggested that Argentina’s disinflation trend is continuing, but at a more gradual and uneven pace than in recent months.
At the same time, the government continued to ease financial conditions in an effort to support economic activity. Authorities announced that they are allowing more liquidity to circulate in the economy and have relaxed longstanding restrictions on dollar lending, permitting banks to lend up to 15% of their dollar deposits to companies that earn revenues in pesos. The peso has weakened as policy has become less restrictive, while officials are also seeking to avoid the sharp spikes in local interest rates that previously constrained credit. Against this backdrop, investors remain focused on whether easier financial conditions can help revive growth without undermining further progress on inflation and currency stability.
Fixed income markets
Last week, the Bloomberg Global Aggregate Index (hedged to USD) fell slightly, down -0.2% overall (0.4% YTD), the Bloomberg Global High Yield Index (hedged to USD) added 0.1% (3.2% YTD), and the Bloomberg Emerging Markets Hard Currency Aggregate Index advanced 0.1% (1.3% YTD).
US Treasury yields were volatile through most of the week, rising on Monday as higher oil prices fuelled inflation concerns before decreasing following July’s relatively benign inflation data. By Friday, shorter-term yields were generally lower as rate-hike expectations eased, while longer-term yields remained elevated amid heavy supply and persistent fiscal concerns. The Treasury Department’s 10-year note auction cleared at its highest yield since 2007, while Thursday’s 30-year bond auction cleared at its highest yield since 2001. After ending the prior week at 4.65%, the yield on the US 10-year Treasury note rose to 4.69% by Friday. The yield remains up 52bps YTD. The 2-year Treasury yield decreased by -3bps, ending the week at 4.17% from 4.20% (up 69bps YTD).
Over the week, the 10-year German Bund yield also increased, ending at 3.20% from 3.13% (up 35bps YTD). The 10-year UK gilt yield rose by 12bps, ending the week at 5.04% from 4.92% (up 56bps YTD).
Our Weekly Market Recap is designed to keep you updated on the previous week's major events and developments. It includes:
- Concise summaries of key market events and trends
- Insights and analysis from our expert team
- Market perspectives to aid your client conversations
Global Investment Solutions Team
 Yoram Lustig, CFA, PRM™
Head, Global Investment Solutions, EMEA
Yoram Lustig, CFA, PRM™
Head, Global Investment Solutions, EMEA
Yoram Lustig is the head of Global Investment Solutions, EMEA, and a portfolio manager in the Multi-Asset Division. He also is the chair of the UK and European Investment Committees and a member of the Multi-Asset Steering Committee.
 Michael Walsh, CFA, CAIA®, FIA
Solutions Strategist
Michael Walsh, CFA, CAIA®, FIA
Solutions Strategist
Michael Walsh is a London-based solutions strategist on the Multi-Asset Solutions team for EMEA. He is a vice president of T. Rowe Price Group, Inc., and T. Rowe Price International Ltd.
 Eva Wu, CFA
Associate Solutions Strategist
Eva Wu, CFA
Associate Solutions Strategist
Eva Wu is an associate solutions strategist on the Multi-Asset Solutions team in the Multi-Asset Division. She is a vice president of T. Rowe Price International Ltd.
 Matt Bance, CFA
Solutions Strategist
Matt Bance, CFA
Solutions Strategist
Matt Bance is a solutions strategist and portfolio manager on the Multi-Asset Solutions team for the Europe, Middle East, and Africa region. He is a vice president of T. Rowe Price International Ltd.
202608 - 5845049
Notes
All data and index returns cited herein are the property of their respective owners, and provided to T. Rowe Price under license via data sources including Bloomberg Finance L.P., FactSet & RIMES, MSCI, FTSE and S&P. All rights reserved. T. Rowe Price seeks to cite data from sources it deems to be accurate, but it cannot guarantee the accuracy of any data cited herein. Neither T. Rowe Price, nor any of its third-party data vendors make any express or implied warranties or representations and shall have no liability whatsoever with respect to any data and index returns contained herein. The data and index returns cited herein may not be further redistributed or used as the basis for other indices, as a benchmark or as the basis for any other financial product.
The specific securities identified and described are for informational purposes only and do not represent recommendations.
CFA® and Chartered Financial Analyst® are registered trademarks owned by CFA Institute.
Important Information
The specific securities identified and described are for informational purposes only and do not represent recommendations.
This material is being furnished for general informational and/or marketing purposes only. The material does not constitute or undertake to give advice of any nature, including fiduciary investment advice, nor is it intended to serve as the primary basis for an investment decision. Prospective investors are recommended to seek independent legal, financial and tax advice before making any investment decision. T. Rowe Price group of companies including T. Rowe Price Associates, Inc. and/or its affiliates receive revenue from T. Rowe Price investment products and services. Past performance is not a guarantee or a reliable indicator of future results. The value of an investment and any income from it can go down as well as up. Investors may get back less than the amount invested.
The material does not constitute a distribution, an offer, an invitation, a personal or general recommendation or solicitation to sell or buy any securities in any jurisdiction or to conduct any particular investment activity. The material has not been reviewed by any regulatory authority in any jurisdiction.Information and opinions presented have been obtained or derived from sources believed to be reliable and current; however, we cannot guarantee the sources’ accuracy or completeness. There is no guarantee that any forecasts made will come to pass. The views contained herein are as of the date written and are subject to change without notice; these views may differ from those of other T. Rowe Price group companies and/or associates. Under no circumstances should the material, in whole or in part, be copied or redistributed without consent from T. Rowe Price.The material is not intended for use by persons in jurisdictions which prohibit or restrict the distribution of the material and in certain countries the material is provided upon specific request. It is not intended for distribution to retail investors in any jurisdiction.
Information and opinions presented have been obtained or derived from sources believed to be reliable and current; however, we cannot guarantee the sources’ accuracy or completeness. There is no guarantee that any forecasts made will come to pass. The views contained herein are as of the date written and are subject to change without notice; these views may differ from those of other T. Rowe Price group companies and/or associates. Under no circumstances should the material, in whole or in part, be copied or redistributed without consent from T. Rowe Price.
The material is not intended for use by persons in jurisdictions which prohibit or restrict the distribution of the material and in certain countries the material is provided upon specific request. It is not intended for distribution to retail investors in any jurisdiction.