

Choose your location
Belgium
English
Belgium
Denmark
Estonia
Finland
France
Iceland
Ireland
Latvia
Lithuania
Luxembourg
Netherlands
Norway
Portugal
Sweden
United Kingdom
 19 October 2026
Weekly Market Recap
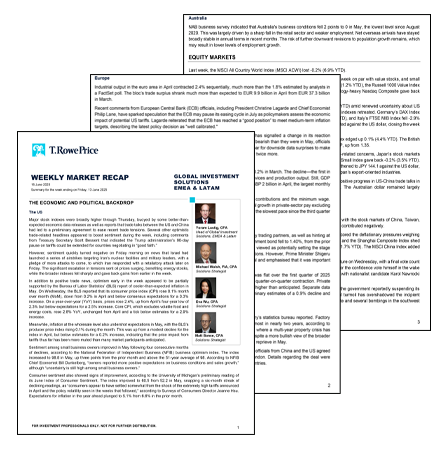
Our Global Investment Solutions team summarise the week's key market events and developments — with insights to support your client conversations and decision-making.
Key resources
Weekly Market article


Weekly Market data

Economic and political backdrop
The UK
UK GDP expanded 0.1% in August versus expectations for a 0.1% decline. Manufacturing production in the country jumped 1.2% month on month, while industrial production rose 0.8%. The monthly trade deficit also narrowed.
The US
The Bureau of Labor Statistics reported that its consumer price index (CPI) rose 3.7% year over year in September, above consensus estimates for a 3.6% increase and up from the prior month’s 3.4% rise. Core CPI, which excludes food and energy costs, rose 2.6% year over year, accelerating from August’s 2.4% increase. On a month-over-month basis, gasoline prices rose 9.1%, accounting for more than half of the headline index’s increase.
Thursday's producer price index (PPI) report also highlighted accelerating price growth, with wholesale prices increasing 6.3% year over year, well above expectations for a 5.4% gain and the largest annual increase since December 2022.
Meanwhile, comments from Federal Reserve (Fed) Chair Kevin Warsh provided little clarity on what Fed policymakers will decide at their upcoming October meeting, noting that the central bank is no longer in the business of prejudging meeting outcomes and that he wants investors to focus on the economy. By Friday afternoon, data from the CME FedWatch Tool showed a roughly 17% probability of a rate hike at the meeting, little changed from the prior week despite the hotter-than-expected inflation prints.
The Census Bureau reported Thursday that US retail sales increased 0.8% in September, exceeding consensus expectations, although much of the increase was attributed to a 6.4% jump in gas station receipts. Control group sales—which exclude several categories, including gasoline, and feed into gross domestic product (GDP) calculations—rose just 0.1%, down from August’s revised 1.2% increase and below estimates for around 0.3%.
Meanwhile, labour market data continued to suggest relatively limited layoffs. Initial applications for unemployment benefits came in at 199,000 for the week ended October 10, little changed from the prior week and the fifth consecutive reading below 200,000. Continuing claims for the prior week decreased by 4,000 to 1.71 million.
Europe
Spanish consumer price inflation was confirmed at 4.9% year over year in September, with core inflation rising to 3.1%. Meanwhile, French consumer price inflation was revised slightly higher to 3.1%, largely reflecting higher energy prices. Eurozone industrial production fell 0.5% month on month in August. This marked its third consecutive decline and was weaker than observers had expected.
Attacks on Saudi infrastructure and shipping around the Strait of Hormuz intensified this week. The prospect of further action against Iran also remained an overhang, keeping European natural gas prices elevated.
China
China's PPI rose 5.0% year on year in September, up from 3.8% in August and the fastest increase since June 2022, according to the National Bureau of Statistics. Higher energy and other raw material prices contributed to the acceleration. Consumer price inflation edged up to 0.9% from 0.8% in August, while core inflation, which excludes food and energy, was unchanged at 1.0%. The figures pointed to stronger producer-level price pressures without a comparable rise in consumer prices.
China's exports increased 36.3% year on year in September, accelerating from 25.0% in August and exceeding economists' forecasts, according to the General Administration of Customs. Imports grew 31.0%, lifting the monthly trade surplus to a record USD 133.5 billion. Strong overseas demand for technology-related goods, including semiconductors and data-processing equipment, supported export growth.
Japan
Bank of Japan (BoJ) board member Junko Koeda said that financial conditions remained accommodative and underlying inflation was becoming anchored around the central bank's 2% target. Citing considerable upside risks to prices, she cautioned against excessive hesitation in raising interest rates. Governor Kazuo Ueda, in a speech delivered on his behalf by Deputy Governor Shinichi Uchida, reiterated concerns about underlying inflation overshooting the 2% target. Investors continued to anticipate further tightening, with most expecting the BoJ to leave rates unchanged at its October 29–30 meeting before considering another increase in December.
Economic data released during the week showed that Japan's corporate goods prices rose 6.8% year over year in September, below consensus expectations for a 7.6% increase and slowing from 7.6% in August. The moderation suggested some easing in producer price pressures, although inflation remained elevated. Separately, core machinery orders, a leading indicator of capital expenditure, rose 5.2% month over month in August, exceeding expectations and reversing a 3.7% decline in July.
Australia
Australia employment fell 39,300 in September, driven entirely by part-time jobs (-73,700). Unemployment increased to 4.72% from 4.65% previously, despite a decline in participation to 66.8%. The unemployment rate is now the highest in five years.
The minutes from the Research Bank of Australia (RBA) detailed the board’s unanimous decision to raise the cash rate to 4.60% in September. The increase was framed in the context of upside risks materialising, including from the Middle East conflict, AI investment boom, and domestic capacity pressures. The minutes left the door open to a fifth hike. Australia business conditions were unchanged in September, remaining around the lowest level since August 2020.
Canada
Canada shed 68,300 jobs in September — more than erasing all gains made earlier this year — pushing the unemployment rate up to 6.5%. The decline was driven largely by a 70,000 drop in public sector employment.
Albertans are heading to the polls Monday to vote on whether to seek independence from Canada. Over 1 million advance and mail-in ballots have already been cast — a surge that pollsters say may favour the "remain" side.
Markets
Equity markets
Last week, the MSCI All Country World Index (MSCI ACWI) fell -1.6% (12.9% YTD).
The S&P 500 Index finished the week down -1.9% (12.9% YTD) as a sharp sell-off in artificial intelligence (AI)-related stocks, hotter-than-expected inflation data, and the start of third-quarter earnings season drove a rotation away from large-cap growth stocks and into more value-oriented and defensive segments of the market.
The technology-heavy Nasdaq Composite fared worst, declining 4.5% (13.0% YTD) followed by the small-cap Russell 2000 Index, which fell -3.0% (10.8% YTD). The Russell 1000 Value Index outpaced its growth counterpart by more than 5%, rising by 0.9% (23.0% YTD), while the Russell Growth Value Index fell by 5% over the week (3.1% YTD).
Concerns about the sustainability of AI-related investment appeared to be a major driver of the week's sentiment, with semiconductor and memory stocks facing selling pressure amid heightened scrutiny of financing needs, valuations, and potential returns on AI infrastructure spending. Meanwhile, escalating tensions in the Middle East supported oil prices, providing a tailwind for the energy sector.
In Europe, the MSCI Europe ex-UK Index rose 2.1% (11.5% YTD). The European earnings reporting season got underway, shifting investors’ attention back to corporate fundamentals. However, Middle East tensions and energy prices remained a major market driver. Among major stock indexes, Germany’s DAX Index was up 2.1% (4.6% YTD), France’s CAC 40 Index gained 2.0% (0.6% YTD), and Italy’s FTSE MIB Index rallied by 0.2% (14.4% YTD). Switzerland’s SMI put on 4.4% (11.8% YTD). The euro was flat against the US dollar, closing the week at USD 1.12 per EUR.
The FTSE 100 Index in the UK also rose, by 3.2% (12.5% YTD), while the FTSE 250 Index of smaller companies gained 1.4% (12.1% YTD). The British pound rose versus the US dollar for the week, closing at USD 1.33 per GBP, compared to USD 1.32 per GBP at the end of the previous week.
Japanese stocks fell over the holiday-shortened week, with markets closed on Monday. The TOPIX Index declined -0.9% (21.8% YTD), and the TOPIX Small Index fell -1.0% (21.1% YTD). The technology sector’s significant underperformance reflected pronounced weakness in major AI- and semiconductor-related shares, with losses concentrated in Thursday’s sell-off before a partial rebound on Friday. Higher-than-expected US inflation revived concerns about the outlook for interest rates and elevated valuations, while growing scrutiny of the substantial borrowing required to finance AI infrastructure investment further weighed on sentiment. Elevated oil prices and geopolitical uncertainty, particularly surrounding the ongoing conflict in the Middle East and risks to energy supplies, added to investor caution.
The yield on the 10-year Japanese government bond fell to 2.94% from 3.01% at the end of the previous week. Yields touched five-week lows on Thursday amid increased demand for safer assets following the global equity sell-off and a broader decline in government bond yields before recovering part of the move on Friday as risk aversion eased. The yen was broadly range-bound around JPY 158 against the US dollar over the week. Investors weighed expectations for further interest rate increases in Japan against uncertainty over the outlook for US monetary policy, with the interest rate differential between the two countries remaining an important driver of the exchange rate.
In Australia, the ASX 200 Index rose 1.1% (4.9% YTD) as materials sector rebounded on improved global risk sentiment on Friday. Australian government bond yields fell following the September job miss, with the curve modestly flattening. The Australian dollar weakened against the US dollar by 0.4%.
In Canada, the S&P/TSX Composite finished the week up 1.4% (16.1% YTD).
Emerging markets and other markets
The MSCI Emerging Markets Index ended the week down -5.1% (17.5% YTD). Indian stocks rallied, while shares in China, Taiwan, Brazil and South Korea contributed negatively.
Chinese equities declined over the week, with mainland markets underperforming Hong Kong as selling in previously strong semiconductor and other AI-related shares weighed on benchmarks. The CSI 300 Index, the main onshore benchmark, was down -3.3% (-8.1% YTD), while the Shanghai Composite Index declined -2.5% (-4.6% YTD). Hong Kong's benchmark Hang Seng Index fell -0.1% (-3.0% YTD). The MSCI China Index, which primarily comprises offshore-listed stocks, fell by 1.6% (-13.0% YTD). The weakness coincided with renewed concerns about the scale and potential returns of AI-related spending and stronger-than-expected US inflation, which revived worries about interest rates. Analysts also cited pressure from mutual fund redemptions. Financial shares generally held up better than technology stocks. Mainland equities recovered modestly on Friday, helped by announcements of share buybacks and upbeat profit forecasts from several technology companies, alongside gains in property shares. Separately, inflows into some broad-based exchange-traded funds were reported, although any state-backed buying was unconfirmed.
South Korean equities declined sharply over the week as a global sell-off in semiconductor and AI-related stocks intensified, driven by concerns about elevated valuations and the sustainability of AI infrastructure spending. Shares of memory-chip leaders Samsung Electronics and SK Hynix came under significant selling pressure as investors reassessed the outlook for AI-related demand, rising financing costs, and increasing competition from Chinese chipmakers. The benchmark KOSPI fell to a six-month low on Thursday, triggering a temporary trading halt as selling accelerated. Markets subsequently rebounded on Friday, supported by renewed buying in technology shares and easing concerns about near-term US interest rate increases, although the recovery only partially offset earlier losses.
Foreign investor selling added to market volatility, extending a broader retreat from Asian financial assets amid rising global borrowing costs and uncertainty surrounding the outlook for US monetary policy. Stronger-than-expected inflation data increased concerns that the Fed could raise interest rates further, putting additional pressure on investor sentiment. The Korean won weakened against the dollar during Thursday’s sell-off, while government bond yields declined as investors sought relatively safer assets. In response to the equity market turmoil, South Korea’s Financial Services Commission convened an emergency meeting Thursday to assess market conditions and strengthen coordination among financial authorities. The won subsequently recovered on Friday, while government bonds advanced as yields eased further. Despite the late-week improvement, uncertainty surrounding AI investment, foreign capital flows, and the global interest rate outlook continued to shape market sentiment.
Indian equities advanced over the week, supported by a strong rebound in information technology shares as investors shifted away from global semiconductor and AI-related stocks. The sector benefited from improving earnings expectations and more attractive valuations following earlier weakness, with positive results and guidance from major software exporters helping bolster sentiment. The rally contributed to the strongest weekly gains in six months for India's benchmark Sensex and Nifty indexes.
The Indian rupee also strengthened sharply, posting its best weekly performance in seven months as aggressive measures by the Reserve Bank of India (RBI) to stabilize the currency coincided with a weaker US dollar, easing oil prices, and stronger domestic equities. The central bank introduced restrictions on foreign exchange transactions to curb speculative pressure and dollar demand while also tightening domestic liquidity conditions. However, these measures disrupted currency hedging activity and contributed to higher borrowing costs. Government bonds declined as yields rose, reflecting tighter liquidity and growing expectations that the RBI could raise interest rates further to contain inflation and defend the rupee. Despite the currency's recovery, elevated energy prices, foreign capital outflows, and uncertainty surrounding the monetary policy outlook continued to weigh on bond market sentiment.
Fixed income markets
Last week, the Bloomberg Global Aggregate Index (hedged to USD) returned 0.7% (-0.4% YTD), the Bloomberg Global High Yield Index (hedged to USD) -0.1% (0.7% YTD), and the Bloomberg Emerging Markets Hard Currency Aggregate Index 0.7% (-1.1% YTD).
US Treasuries advanced as the sharp sell-off in technology stocks appeared to fuel demand for government bonds, particularly longer-dated Treasuries, outweighing the upward pressure on yields from the week's inflation reports. Over the week, the 10-year Treasury yield decreased by -16bps to 5.08% from 5.24% (up 91bps YTD). The 2-year Treasury yield decreased by -8bps, ending the week at 4.71% from 4.79% (up 123bps YTD).
Investment-grade corporate bonds also advanced, outperforming Treasuries over most of the week, while the high yield bond market experienced a sharp risk-off shift following Wednesday’s CPI report.
Over the week, the 10-year German Bund yield fell by -6bp, ending at 3.42% from 3.48% (up 57bps YTD). The 10-year UK gilt yield fell by -7bps, ending the week at 5.37% from 5.44% (up 89bps YTD).
Our Weekly Market Recap is designed to keep you updated on the previous week's major events and developments. It includes:
- Concise summaries of key market events and trends
- Insights and analysis from our expert team
- Market perspectives to aid your client conversations
Global Investment Solutions Team
 Yoram Lustig, CFA, PRM™
Head, Global Investment Solutions, EMEA
Yoram Lustig, CFA, PRM™
Head, Global Investment Solutions, EMEA
Yoram Lustig is the head of Global Investment Solutions, EMEA, and a portfolio manager in the Multi-Asset Division. He also is the chair of the UK and European Investment Committees and a member of the Multi-Asset Steering Committee.
 Michael Walsh, CFA, CAIA®, FIA
Solutions Strategist
Michael Walsh, CFA, CAIA®, FIA
Solutions Strategist
Michael Walsh is a London-based solutions strategist on the Multi-Asset Solutions team for EMEA. He is a vice president of T. Rowe Price Group, Inc., and T. Rowe Price International Ltd.
 Eva Wu, CFA
Associate Solutions Strategist
Eva Wu, CFA
Associate Solutions Strategist
Eva Wu is an associate solutions strategist on the Multi-Asset Solutions team in the Multi-Asset Division. She is a vice president of T. Rowe Price International Ltd.
 Matt Bance, CFA
Solutions Strategist
Matt Bance, CFA
Solutions Strategist
Matt Bance is a solutions strategist and portfolio manager on the Multi-Asset Solutions team for the Europe, Middle East, and Africa region. He is a vice president of T. Rowe Price International Ltd.
202610 - 6031089
Notes
All data and index returns cited herein are the property of their respective owners, and provided to T. Rowe Price under license via data sources including Bloomberg Finance L.P., FactSet & RIMES, MSCI, FTSE and S&P. All rights reserved. T. Rowe Price seeks to cite data from sources it deems to be accurate, but it cannot guarantee the accuracy of any data cited herein. Neither T. Rowe Price, nor any of its third-party data vendors make any express or implied warranties or representations and shall have no liability whatsoever with respect to any data and index returns contained herein. The data and index returns cited herein may not be further redistributed or used as the basis for other indices, as a benchmark or as the basis for any other financial product.
The specific securities identified and described are for informational purposes only and do not represent recommendations.
CFA® and Chartered Financial Analyst® are registered trademarks owned by CFA Institute.
Important Information
The specific securities identified and described are for informational purposes only and do not represent recommendations.
This material is being furnished for general informational and/or marketing purposes only. The material does not constitute or undertake to give advice of any nature, including fiduciary investment advice, nor is it intended to serve as the primary basis for an investment decision. Prospective investors are recommended to seek independent legal, financial and tax advice before making any investment decision. T. Rowe Price group of companies including T. Rowe Price Associates, Inc. and/or its affiliates receive revenue from T. Rowe Price investment products and services. Past performance is not a guarantee or a reliable indicator of future results. The value of an investment and any income from it can go down as well as up. Investors may get back less than the amount invested.
The material does not constitute a distribution, an offer, an invitation, a personal or general recommendation or solicitation to sell or buy any securities in any jurisdiction or to conduct any particular investment activity. The material has not been reviewed by any regulatory authority in any jurisdiction.Information and opinions presented have been obtained or derived from sources believed to be reliable and current; however, we cannot guarantee the sources’ accuracy or completeness. There is no guarantee that any forecasts made will come to pass. The views contained herein are as of the date written and are subject to change without notice; these views may differ from those of other T. Rowe Price group companies and/or associates. Under no circumstances should the material, in whole or in part, be copied or redistributed without consent from T. Rowe Price.The material is not intended for use by persons in jurisdictions which prohibit or restrict the distribution of the material and in certain countries the material is provided upon specific request. It is not intended for distribution to retail investors in any jurisdiction.
Information and opinions presented have been obtained or derived from sources believed to be reliable and current; however, we cannot guarantee the sources’ accuracy or completeness. There is no guarantee that any forecasts made will come to pass. The views contained herein are as of the date written and are subject to change without notice; these views may differ from those of other T. Rowe Price group companies and/or associates. Under no circumstances should the material, in whole or in part, be copied or redistributed without consent from T. Rowe Price.
The material is not intended for use by persons in jurisdictions which prohibit or restrict the distribution of the material and in certain countries the material is provided upon specific request. It is not intended for distribution to retail investors in any jurisdiction.