

The Changing Face of Value
Executive Summary
- For many value investors, the last few years have proved to be a challenging period given a backdrop of low growth, structural change in China, elevated macroeconomic risks, and bouts of volatility. This environment has led to a dominance of growth and quality factors, creating a meaningful headwind for value-oriented stocks.
- While the temptation is to assume that a broad-based trend of value outperformance is on the horizon, especially after a show of relative strength from commodities in the year to date, our perspective is that the market backdrop doesn’t indicate such a clear signal. However, there are signs of material evolution that should make for a more level playing field between value and growth.
- Value signals are arguably as dispersed as they have been for some time, but this is not unreasonable given the environment we find ourselves in.
- More so than ever, value investing must be approached in a multidimensional way to achieve the best results. A focus on free cash flow (FCF) has been imperative in this current environment in which price to book (P/B) has been a particularly poor predictor of returns.
- While disconcerting for some, the long term and cyclical changes apparent in recent years imply elevated uncertainty but with it, potential opportunity for value investors.
A CHALLENGING ENVIRONMENT FOR VALUE INVESTORS
The last five years have been challenging for many value-oriented investors given a backdrop of rising macroeconomic risks and bouts of volatility. While growth stocks have a natural tendency to go through an outperformance cycle when broad-based growth becomes scarce (because investors are more willing to pay a premium), the magnitude of underperformance of many value factors is one of today’s big investment puzzles (see Figure 1).
FIGURE 1: Value versus growth performance
December 1995 through June 2016
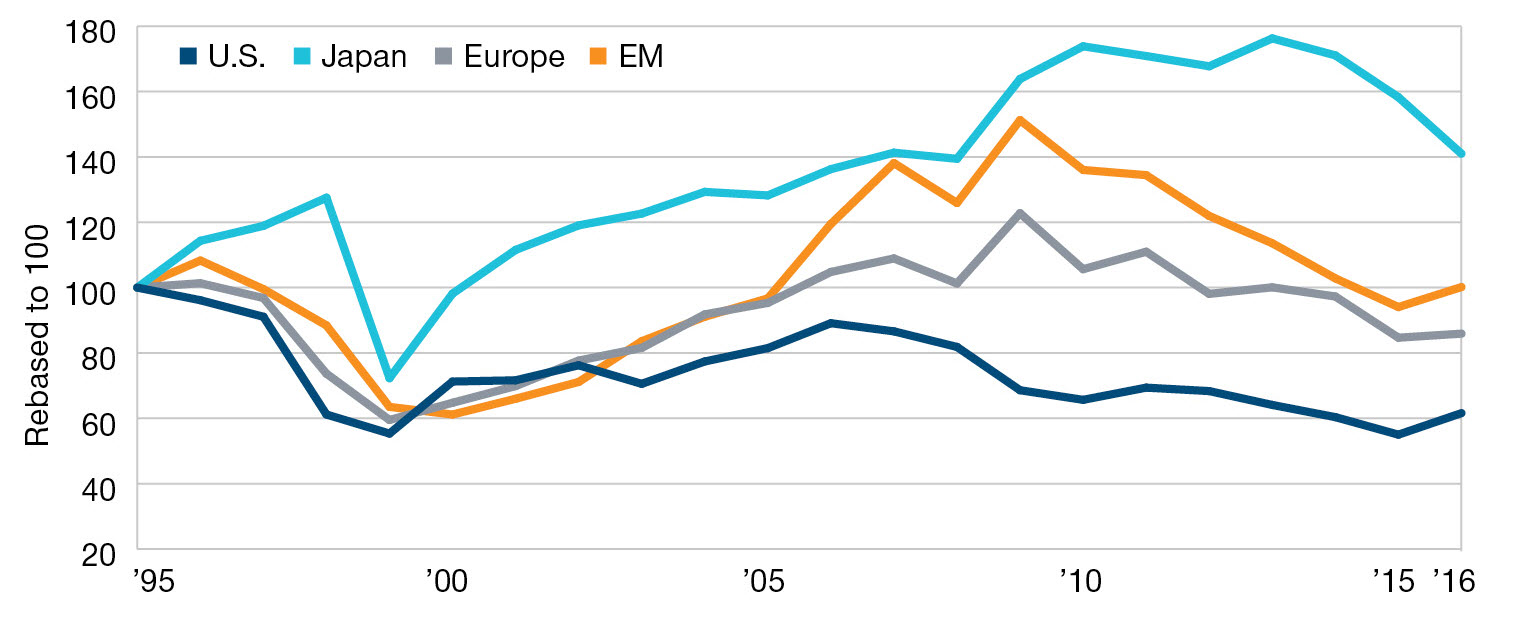
Represents the performance return of individual markets, represented by each market’s primary equity index.Sources: Citi Research and FactSet, as of June 30, 2016.
Value strategy based on the four cheapest versus four most expensive sectors at the beginning ofeach calendar year.
So what has led to this underperformance, and are we on the cusp of a value cycle?
THE CHINA HEADWIND
One of the most significant headwinds for value investors can be found outside of many value managers’ direct investment universe—China.
The Chinese economy is transitioning through a multiyear deceleration that has both internal and external consequences for investors. In recognition of the need to adjust its economic model, policymakers are overseeing a shift from the industrial- and investment-led growth model toward the services sector and the consumer. This change is unparalleled given the magnitude of China’s economy today, and one consequence has been a meaningful drag on global growth. This has also coincided with a period when developed world policymakers have been desperately trying to stimulate their individual and collective growth levels to assist the healing process from the multiple scars of the 2008/2009 financial crisis. Despite an unprecedented level of stimulus, economic growth in most major developed market economies has remained underwhelming.
The consequences of anemic growth are broad, but they have been felt especially hard in cyclical industries. Most important from a value investors perspective, financials and especially the global banking industry have weighed on performance. A low-growth/low-rates environment, as well as ongoing regulation have damaged earnings power for the banking sector preventing any recovery in valuations.
Commodity-oriented industries have also suffered given the extreme commodity price weakness that has prevailed in recent years. The protracted nature of the adjustment and its links to the long term changes occurring in China have made predicting the turn in the commodity cycle a miserable pursuit.
While it might be tempting to highlight the relatively modest nature of commodity stock exposure in global indices, the bigger and more complex theme of excess capacity is the main point to note. The impact of this excess supply has been felt hard by banks in their loan books and industrial companies exposed to natural resource extraction. Large parts of the emerging market commodity-producing world have also been negatively impacted.
In aggregate, the economic backdrop in recent years has lowered the prospects of a cyclical recovery, and made trading cycles for certain stocks quicker and more violent. Meanwhile, it has also occurred in tandem with many growth-oriented stocks being fed by a “virtuous” sentiment cycle, which taken together has created headwinds for some value signals.
VALUE FACTOR DISPERSION— A NEW ERA?
Is there a way to quantify more precisely why recent years have been so challenging for value investors?
FIGURE 2: Dispersion across value factors has increased
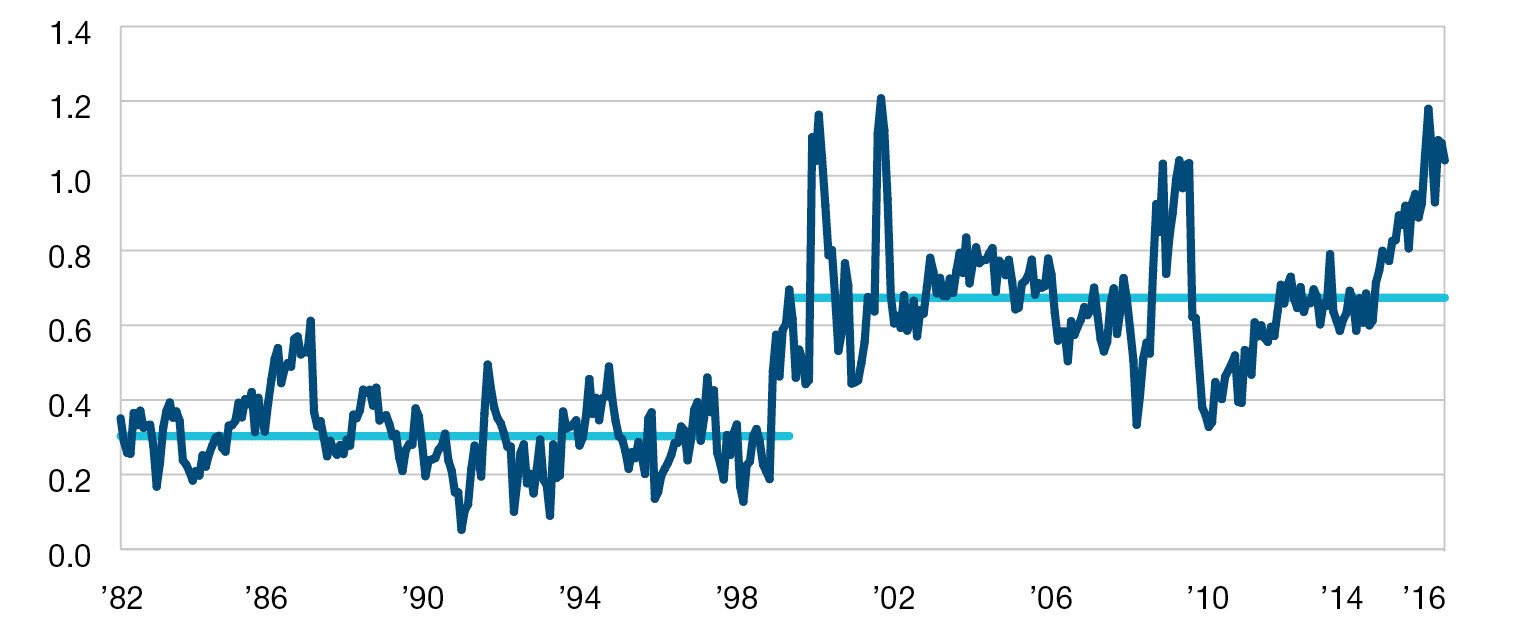
Note: Shows cross-sectional standard deviation of de-trended and normalized dispersion among six valuefactors (price-to-book, price-to-earnings, dividend yield, price-to-sales, and EBITDA-to-EV). Light blue linesshow median value from January 1982 to December 1999 and from January 2000 to August 2016. Thedispersion of value factors is calculated by median absolute deviation/median. Universe is the Russell 1000Index. Period of analysis is from January 1982 through August 2016.Sources: Russell, Compustat, I/B/E/S, and Nomura Research.
We note two distinct regimes. In the first, from 1982 through to 1999, dispersion across value factors was low, meaning that the choice of your dominant factor or weight between value factors mattered less. In the second period since 2000, a different regime seems to have taken hold, with much higher levels of dispersion across value factors. The spikes in dispersion appear to coincide with periods when segments of the value spectrum have been called into serious question—financials around the financial crisis in 2008 and, more recently, with concerns centered on many cyclicals and the relevance of value when such large long term headwinds are apparent. Put simply, it is no longer sufficient to merely talk about a value premium. One must increasingly specify how the value premium is measured and where it is developing in a way that can be captured.
WHERE IS THE VALUE?
So if value factors have become increasingly dispersed, which value factors have performed or lagged as alpha signals? In many respects, 2015 could arguably be seen as a peak in the value complexity equation and typifies the complexity investors have faced. A strategy based on the cheapest P/B stocks in the market as well as a similar strategy based on stocks with below-average P/E ratios, meaningfully underperformed the overall market. In turn, P/E as a factor has appreciably underperformed an FCF-based approach in a period where cash has taken on newfound significance to investors, activists, and corporate management teams. In a yield-hungry and risk-averse world, the generation and use of FCF via capital allocation policy has been a stock-specific theme that has been the friend of many investors.In summary, while dispersion gives a sense of how the value premium has evolved, it has also affirmed the importance of remaining multidimensional in your approach to value investing.
So how can we assess the relative cheapness of value metrics after a period of extreme dispersion to give some sense of forward-looking opportunity?
One approach is to look at the headline sector level by taking the four most expensive sectors and dividing the average valuation on differing valuation measures by the four cheapest sectors to create a valuation ratio. On this measure, the metric that appears to be both flashing “buy” and beginning to turn in 2016 is P/B (see Figure 3). Indeed, this ratio sits around levels last reached in the late 1990s, a point when a broad spectrum of value metrics was indicating a value cycle were overdue. However, this particular measure fully incorporates the skew of low-P/B sectors, which are front and center in the long term changes we are witnessing: energy, materials, utilities, and financials. This clearly highlights that the biggest optical source of opportunity for value investors is situated in some of the most deeply contrarian segments of the market.
FIGURE 3: Book value opportunity?
December 1995 through June 2016
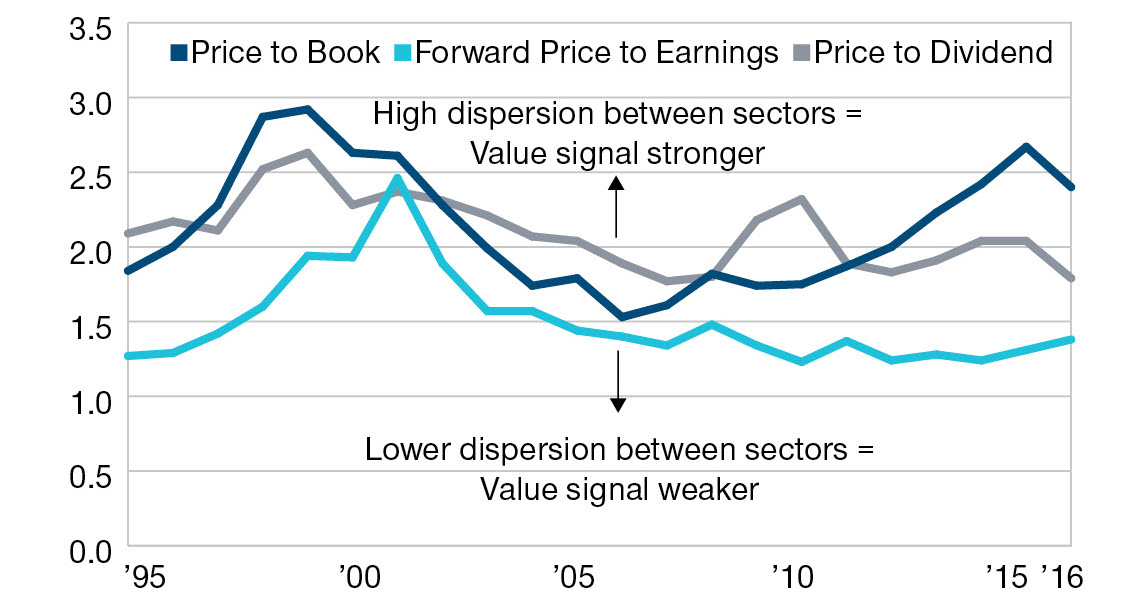
Sources: Citi Research and FactSet.Value strategy based on the four cheapest versus four most expensive sectors atthe beginning of each calendar year.
Broadening out the analysis beyond P/B, the value opportunity as measured by sector-based P/E ratios looks less clear. The implication is that the opportunity to profit from dispersed P/E ratios by capitalizing on mean reversion and the mispricing of assets has rarely been so narrow. Some of this compression is due to the collapse of earnings in materials-based sectors, but dividend-based analysis highlights a similar trend. Such a backdrop implies the need to employ a more stock-specific approach.
IS CASH KING?
One factor that has proven to be a successful driver of returns for value investors has been the identification of higher FCF-yielding stocks (see Figure 4). Part of the reason may be the more tangible nature of cash-based valuation approaches, as opposed to the more accounting-based nature of P/B value. We believe the success of cash-based approaches to value investing has been compounded by a yield-starved environment after the global financial crisis, where both cash flow and the return of cash to shareholders have taken on more significance. This is especially true from a sentiment perspective, where cash flow has been translating into dividends and share buybacks in many cases, with the added pressure from the rise of activist investors accelerating the process like never before.FIGURE 4: An FCF-based focus has been essential
December 1995 through June 2016
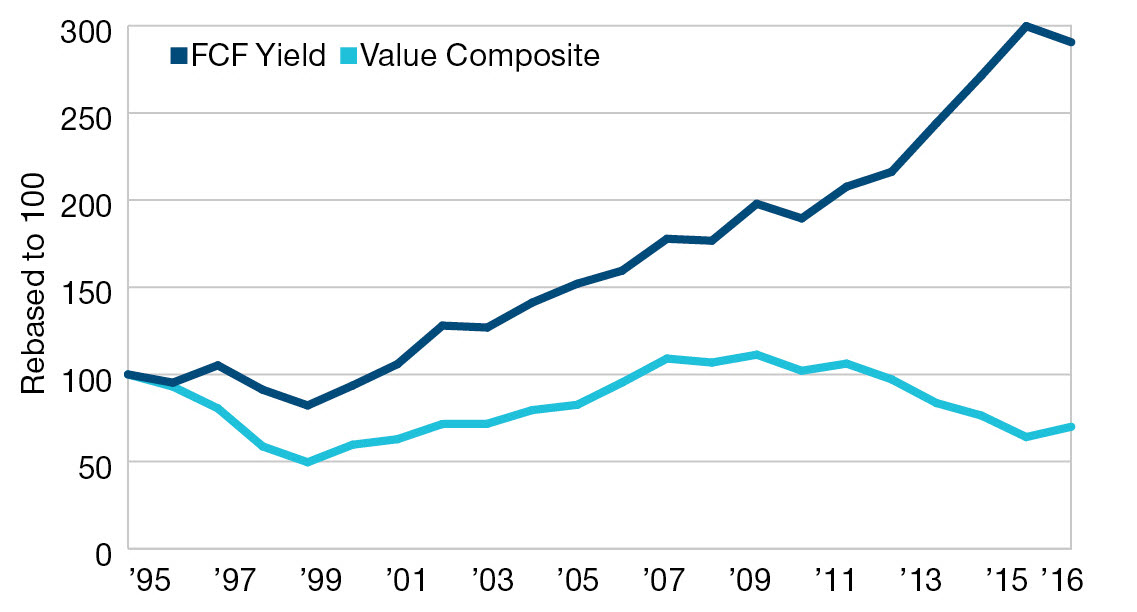
Sources: Citi Research and FactSet.
Another driver of outperformance can be linked to higher FCF-yielding stocks being central to much of the industry consolidation over the last few years. In the case of target/acquired companies, this immediate and near-term recognition of the value premium has been of great help to value investors starved of
broad-based tailwinds.
IS A VALUE CYCLE FINALLY ON THE HORIZON?
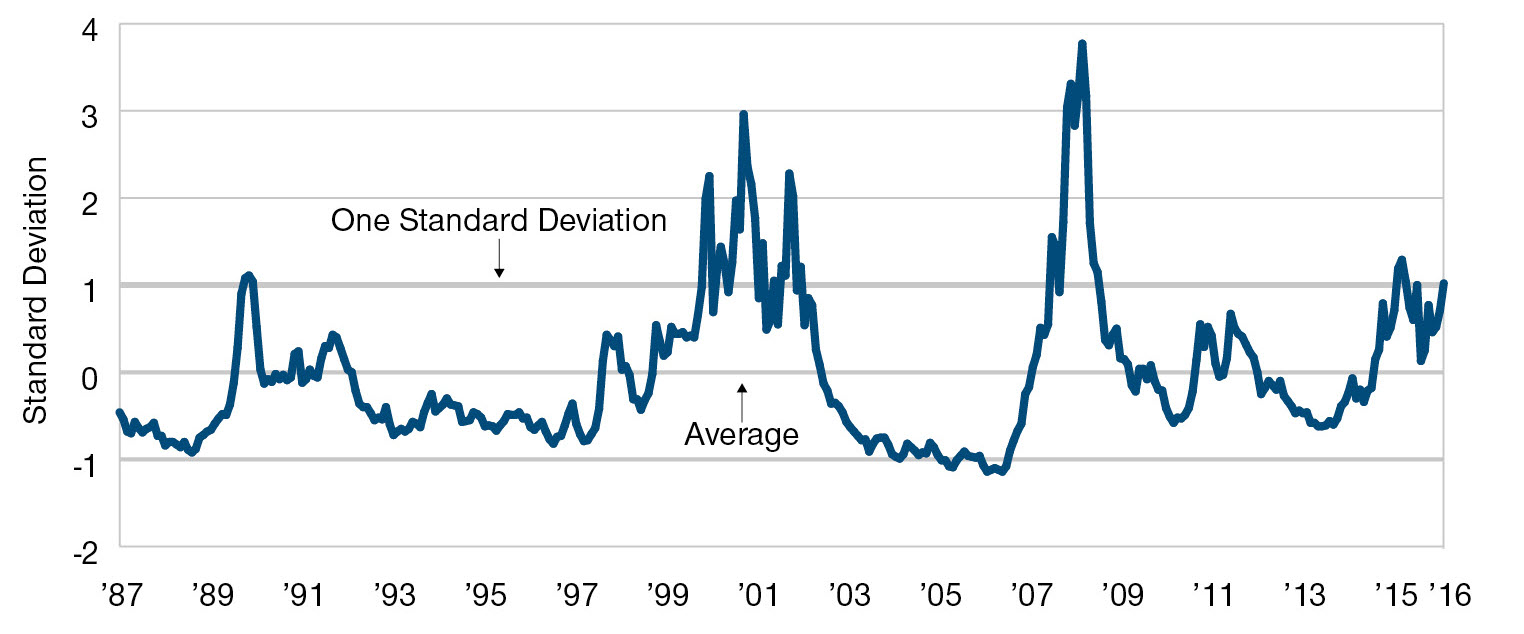
The headwinds for value investing are fading, and opportunities for value investors are broadening. Indeed, even with significant underperformance by the financials sector, value has outperformed so far in 2016 with the MSCI World Value Index exceeding the MSCI World Growth Index return by 224 bps.1Key to this subtle change is that having observed a period of unusually narrow valuation spreads during recent years of the equity bull market, stock-specific valuation multiples have widened (see Figure 5), creating a better backdrop for value stock pickers. Indeed, following a volatile start to 2016 on China and oil-related concerns, and then the surprise Brexit vote, controversy, confusion, and uncertainty have reigned, allowing them to widen further. The fickleness of investor sentiment has subsequently been shown in a strong summer for equity markets and cyclicals in particular.
FIGURE 5: Valuation spreads are widening
January 1987 through June 2016
Source: Empirical Research Partners Analysis.
Value investors have also noted the fading of the powerful surge of U.S. growth stocks that occurred in 2015 where five growth stars, the FANGS (Facebook, Amazon, Netflix, Google, and Salesforce.com), accounted for over 95% of the S&P 500 Index’s returns. This year, the correlation between these stocks has fallen as investor sentiment has begun to normalize. This has subsequently eased the pressure on value indices.
Despite these evolutions, we would caution that calling the precise turn in a style cycle is beyond most investors’ predictive ability. The challenge of timing is typified by predicting the conditions under which deeply cyclical segments of the market might begin to show improvement. Conditions would likely include strong and positive economic surprises, which would assist financials and industrials (although such a growth surprise is not our base case). A fiscal policy response by global governments, as we are witnessing in Japan, would also likely lead to a rally in value-oriented segments of the market. On this point, we are seeing signs of change. Easier fiscal policy is being discussed in public in the United States (by both candidates) and in the U.K., given the need to boost the economy post Brexit. Even in Europe, there are indications that decision makers may be changing stance on fiscal tightness and austerity, primarily due to quantitative easing losing its shock and awe power. The timing and likelihood of such coordinated policy, however, remains uncertain.
FOCUS ON THE FUNDAMENTALS, BUT BE WILLING TO ADAPT
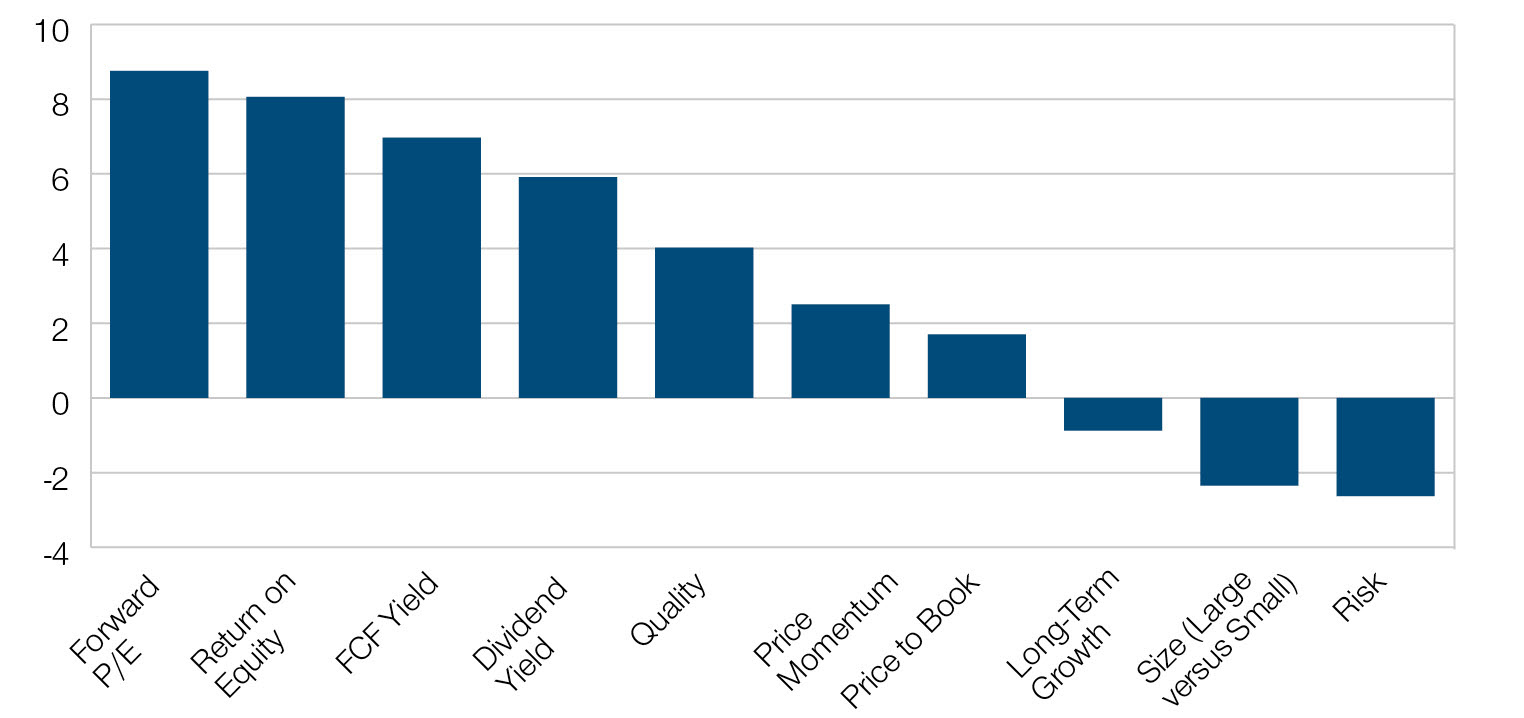
We therefore issue a reminder that patience is a perennial friend of the value investor. Valuation and value factors have been a founding principle of long-term superior performance (see Figure 6) and we believe this is likely to remain the case over the long term.
FIGURE 6: Value factors remain powerful drivers of return
Global Factors: Average Annualized Long/Short Returns since January 1990 to June 2016 (%)
As of June 30, 2016
Sources: IBES, FactSet, and Bernstein Analysis.
Past performance is not a reliable indicator of future performance.
Given this, it is important to both stay the course through market uncertainties but also to balance your approach to value investing. Higher FCF-yielding companies with attractive dividends will remain a source of superior returns, especially in a low-growth world. Additionally, while the top-down news may give little room for cheer in the near term, we still observe many world-class businesses that are now offering more attractive valuations as some of the excesses of sentiment have been worked through. Meanwhile, the refreshing nature of uncertainty and the pullback in some high-growth stocks is making for a more level playing field as we move through a sticky part of the economic cycle. While perhaps not a deep value cycle, stock-specific opportunities for value investors are certainly broadening.
At the same time, in all market environments, we encourage investors to focus on stock fundamentals and to be contrarian, especially during bouts of volatility. One key foundation to investment success in recent years has been the ability to stay engaged with stocks during periods of distressed sentiment in order to benefit from the transition to a better outlook. While it is always tempting to wait for patterns of recovery to be established, history reflects that the early identification of fundamentals stabilizing, or the “stop getting worse” point, is crucial to return generation.
With fundamental changes happening within the value universe, it is important for investors to look at value investing in a forward-looking and more multidimensional way. Successful investing, regardless of philosophy or style, requires a careful blend of evolution and stubbornness. While the evolution in value investing may be disconcerting for some, change implies the mispricing of assets and potentially offers a great source of opportunity for patient and forward-looking value investors.
1Past performance is not a reliable indicator of future performance. Performance YTD to September 30, 2016 (U.S. Dollars %)—MSCI World Growth Index +4.95%, MSCI World Value Index +7.19%. Sources: MSCI and FactSet.
MSCI makes no express or implied warranties or representations and shall have no liability whatsoever with respect to any MSCI data contained herein. The MSCI data may not be further redistributed or used as a basis for other indices or any securities or financial products. This report is not approved, reviewed or produced by MSCI.
2016-GL-4959
重要資訊
本文件(包括其中所載的任何陳述、資訊、數據和內容)以及與本文件一併提供的任何資料、資訊、圖像、連結、聲音、圖像或視頻(統稱為「資料」)乃由普信提供,並僅作一般資訊用途。本資料並不擬供在禁止或限制分發本資料的司法管轄區和在本資料須按特定要求提供的若干國家之人士使用。本資料不擬派發予任何司法管轄區的散戶投資者。在任何情況下,本資料的全部或部分內容均不得在未經普信同意下複製或再分發或出示予任何人士。本資料並不構成於任何司法管轄區分銷、要約、邀請、建議或徵求發售或購買任何證券。本資料並未經由任何司法管轄區的任何監管機關審閱。本資料並不構成任何投資意見,不得加以依賴。投資者務請在作出任何投資決策前先尋求獨立法律和財務意見(包括有關稅務後果的意見)。

