Active Management Study: The Key Takeaways
Investors experienced periods of high volatility during the past 20 years, with two strong U.S. bull markets giving way to two of the most brutal bear markets in recent memory: the collapse of the dot-com bubble in 2000 and the global financial crisis that began in 2007.
Throughout, T. Rowe Price remained committed to disciplined, active investment management. Our research shows that long-term U.S. equity clients have been rewarded.
Note that past performance data throughout this material is not a reliable indicator of future performance. The returns and strategy performance data above were sourced from the study “U.S. Equities: Long-Term Benefits of the T. Rowe Price Approach to Active Management,” April 2016. For more information, please visit troweprice.com/active. For investment professionals only. Not for further distribution.
Outperformance improved over time
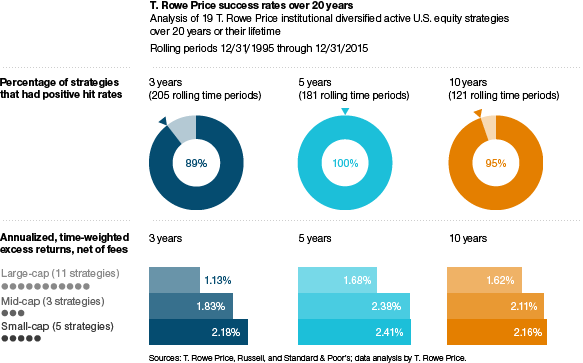
An extensive study by T. Rowe Price shows that we excelled through the many market environments of the past two decades. A majority of our 19 diversified active U.S. equity strategies beat their benchmark across multiple time periods over 20 years or their lifetime.1
Moreover, our outperformance tended to strengthen over time. Seventeen of the 19 strategies had positive hit rates over rolling 3-year periods and 19 over 5-year periods, while 18 strategies were ahead over 10-year intervals.2 A notable 100% generated positive annualized excess returns over rolling 5- and 10-year periods, underlining that it is frequently worth waiting for our long-term active approach to pay off.
Actively managed large-cap strategies proved worth
The study challenges the commonly held belief that it is not possible for active managers to add value in what is widely regarded as the world’s most efficient capital market. The majority of our U.S. large-cap strategies beat their benchmark over all relevant time periods. Again, a long-term mind-set was rewarded as excess returns for our large-cap and mid-cap managers increased over time.
In-depth research from a longstanding team
We attribute our success primarily to careful stock selection and in-depth fundamental research conducted by our long-tenured investment team.
T. Rowe Price employs 161 equity research analysts who together cover 2,300 public companies, equivalent to almost two-thirds of the global markets, as measured by market capitalization. We have a history of developing and retaining talent. On average, portfolio managers have spent 16 years at the company and 21 years in the investment industry, giving them extensive experience in a wide range of market environments.
Independent academic research affirms our approach: Active equity managers, as a group, have been shown to have the skill to select stocks that outperform the broader market, before costs,3 while stable, longstanding active teams appear more likely to excel.4
Our own study shows that a skilled active management approach can help navigate challenging market conditions.
Look to the long term
The factors above will remain central to our approach. We believe it is important to look beyond short-term volatility such as the market sell-off in August 2015 sparked by concerns about the Chinese economy.
We select stocks with potential to create long-term value. The strength of our investment process and research platform gives us confidence that T. Rowe Price can continue to create value for clients over longer time horizons.
1 The study spanned the 20 years up to the end of December 2015 for older strategies, or since inception for newer ones, and measured performance net of fees and trading costs. It covered 19 of the 30 institutional diversified active U.S. equity strategies currently advised by T. Rowe Price. In instances where a portfolio manager managed multiple strategies in a particular sub-asset class style (e.g., U.S. small-cap growth), we used only the strategy with the largest assets under management to avoid double counting. Benchmarks included the S&P 500, Russell 1000 Growth, Russell 2000 Growth, Russell 1000 Value, Russell 2000 Value, Russell 2500, Russell 2000, Russell Mid-cap Growth, and Russell Mid-cap Value Indexes. Strategy performance was measured against the designated benchmarks over rolling 12-month and 3-, 5-, and 10-year periods.
2 Hit rates are the percentage of times a strategy outperformed its designated benchmark in a given period.
3 Includes research by Professor Mark Grinblatt of UCLA and Professor Sheridan Titman of the University of Texas.
4 According to research by Professor Joseph Golec of the University of Connecticut.
2016-GL-3689
重要資訊
本文件(包括其中所載的任何陳述、資訊、數據和內容)以及與本文件一併提供的任何資料、資訊、圖像、連結、聲音、圖像或視頻(統稱為「資料」)乃由普信提供,並僅作一般資訊用途。本資料並不擬供在禁止或限制分發本資料的司法管轄區和在本資料須按特定要求提供的若干國家之人士使用。本資料不擬派發予任何司法管轄區的散戶投資者。在任何情況下,本資料的全部或部分內容均不得在未經普信同意下複製或再分發或出示予任何人士。本資料並不構成於任何司法管轄區分銷、要約、邀請、建議或徵求發售或購買任何證券。本資料並未經由任何司法管轄區的任何監管機關審閱。本資料並不構成任何投資意見,不得加以依賴。投資者務請在作出任何投資決策前先尋求獨立法律和財務意見(包括有關稅務後果的意見)。