
 Active Management Study
T. Rowe Price Strategies: More return. More often.
Our strategies beat their benchmarks more often – and at a higher level – than competitors.*
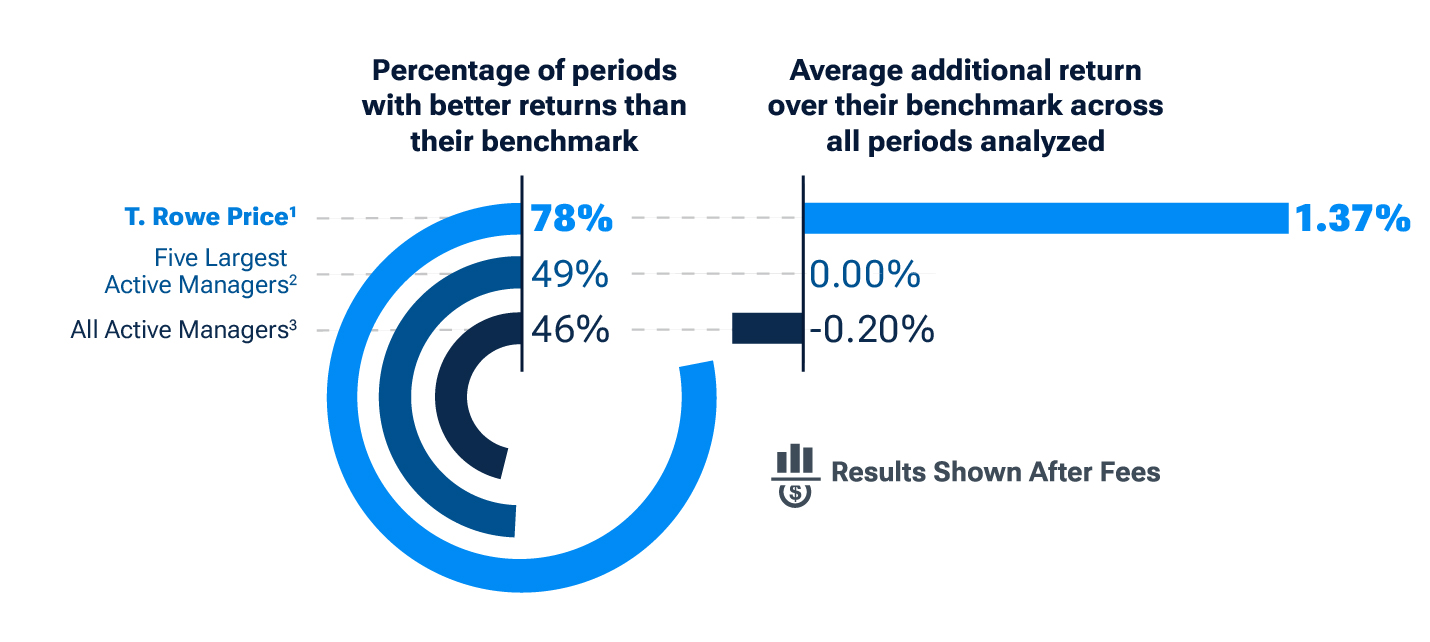
T. Rowe Price equity and fixed income strategies delivered higher average returns than their benchmarks 78% of the time. Plus, they beat their benchmark more frequently—and with better returns—than the average of all active managers. Dive into our active management composite study and learn more about how we achieved this.
See below for standardized returns and other information about the T. Rowe Price composites in this analysis.
Our study covers both equity and fixed income strategies. Learn more about the results of each asset class.
Active Management Makes a Difference
Our strategies delivered higher average returns than their benchmark over time. Plus, they beat their benchmark more frequently—and with better returns—than the average of all active managers.

U.S. Equity
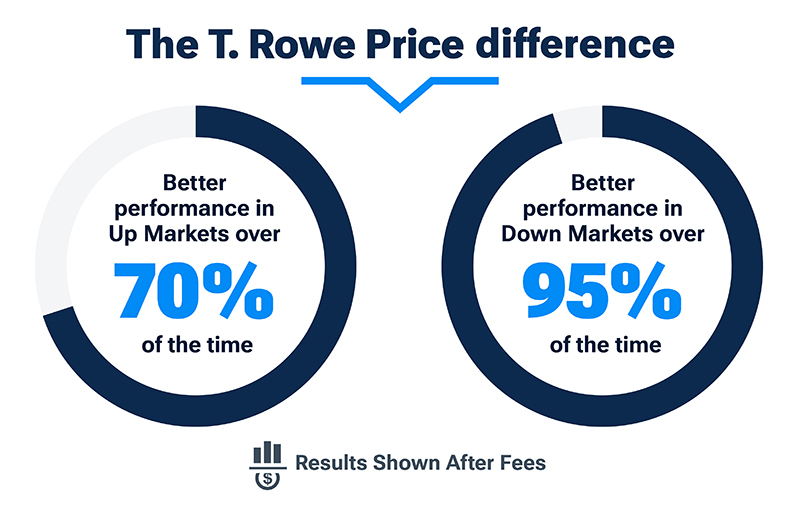
Limiting investors' losses is just as important as—and goes hand in hand with—delivering growth. Our experience and approach have allowed us to both identify potential long-term winners and limit losses in the U.S. market in a variety of economic environments. In both up and down markets our U.S. equity strategies delivered higher average returns than their benchmarks over time – that’s the T. Rowe Price difference.
All Fixed Income
High Yield Fixed Income
Our fixed income strategies also delivered higher average returns than their benchmark as they too benefit from our rigorous global research and independent thinking, leading to fresh insights. Our investment professionals collaborate to develop better questions for better decisions, knowing that identifying risks is as important as identifying opportunities.

The outperformance of our strategies stemmed from our experience and our commitment to rigorous global research, uncovered opportunities with strong return potential and a low risk of defaults and downgrades. Our flexible process enables us to explore the full capital structure, identifying high-conviction ideas by rating class, industry, and issuer.

All Equity
The outperformance in our equity strategies stemmed from our experience and commitment to rigorous global research, which allowed us to uncover equity investment opportunities with long-term growth potential.

More return. More often.
That's the T. Rowe Price difference.
Past performance is no guarantee of future results.
View standardized returns and other information about the T. Rowe Price composites in this analysis.
Learn how this works in practice.
Our head of Institutional Client Service Kim Young recently sat down with Eric Veiel, head of Global Equity and CIO, to discuss how the T. Rowe Price active management approach works on a daily basis, what advantages it brings and how it helps us in seeking to generate alpha for clients.
Explore our Related Insights
Download the full study
*Ten-year periods, rolling monthly, over the last 20 years ended 12/31/24.
Analysis by T. Rowe Price. Represents a comparison of all marketable institutional equity and fixed income composites compared with the official composite primary benchmark assigned to each. Excludes money market, asset allocation, and index/passive composites. An aggregated view of 10-year rolling monthly periods net returns from 1/1/2004 to 12/31/23 is shown. All figures in USD. Competitor data is sourced from Nasdaq’s eVestment Analytics database, and calculated on available net performance over manager selected benchmark figures for comparable products selected based on eVestment Primary Universe and eA Universe Classifications. All Equity or Fixed Income Composites considered except SMA/Wrap – Other, Liquid Real Assets, All Lifestyle/Target Risk Aggressive. Performance information reported by eVestment Alliance is self-reported by contributing firms and is unaudited. Results from other time periods may differ.
Number and Time Periods of Composites
All Strategies
180 composites covering 8,080 rolling 10-year periods.
2435 composites covering 42,038 rolling 10-year periods. The assets under management (AUM) as of 12/31/23 across all composites considered in the analysis are aggregated and those composites offered by the largest five firms determined by total AUM, identified via eVestment, other than T. Rowe Price, are grouped together here. Source: Nasdaq’s eVestment Analytics database.
36,541 composites covering 553,935 rolling 10-year periods. Source: Nasdaq’s eVestment Analytics database.
Risks: All investments are subject to risk, including the possible loss of principal. Equity security prices can be volatile which may result in gains or losses. Fixed income securities are subject to credit risk, liquidity risk, call risk, and interest rate risk. As interest rates rise, bond prices generally fall.
202509-4661260