November 2022 / INVESTMENT INSIGHTS
Window of Opportunity in European Investment Grade?
Attractive valuations amid a weak macroeconomic backdrop
Key Insights
- Heightened volatility has driven investment‑grade spreads to highs last seen in March 2020, but we believe fundamentals are strong relative to history, making current valuations attractive.
- European investment‑grade spreads have become more dispersed, creating potential opportunities for long‑term alpha generation.
- Several risks remain on the horizon, including a eurozone recession and reduced European Central Bank support, making informed security selection vital.
European investment‑grade valuations have improved substantially, in our view. Heightened volatility in recent months has led to significant spread widening in the asset class, but the starting point in terms of corporate fundamentals is one of relative strength. This potentially creates an attractive entry point for investors as all‑in yields are at decade highs. Furthermore, spreads are now more dispersed, which we believe offers more potential alpha‑generation opportunities.
Security selection remains more important than ever, however, given the challenging macroenvironment and the potential for lower earnings, higher funding costs, and reduced European Central Bank support going forward. While a recession is unlikely to be avoided in Europe, it is important to be mindful of the risk of a deeper slowdown should the region experience a colder‑than‑usual winter and a depletion in energy supplies.
Improved Valuations—Time to Buy?
Risk appetite has fallen sharply this year as central banks tightened monetary policy aggressively in response to multi‑decade high inflation. This led to a significant rise in government bond yields and a subsequent fall in risk asset prices globally with spreads on the Bloomberg Euro Aggregate Corporate Index widening out to levels last seen at the start of the coronavirus pandemic in March 2020. As a result of the moves, yields on offer in the asset class are now in excess of 4%1 on average—levels not seen since early 2012, which is an appealing potential income opportunity, particularly for investors with a long time horizon.
Higher All‑In Yields
(Fig. 1) European corporate and government yield
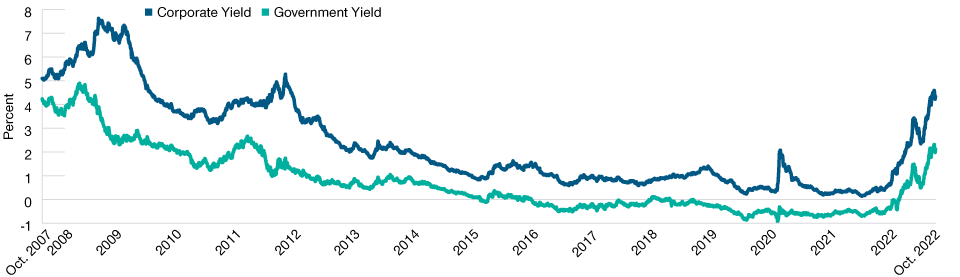
As of 31 October 2022.
Past performance is not a reliable indicator of future performance.
Source: Bloomberg Euro Aggregate Corporate Index: Corporate and German Government Index (see Additional Disclosure).
Although slowing growth is a headwind, companies should be better placed to withstand it than in previous downturns as corporate balance sheets are stronger. Many companies took advantage of the relatively easy financial conditions in recent years to refinance at low borrowing costs. Furthermore, the current slowdown differs from previous slowdowns in some distinct ways. Namely, it’s the result of inflation and the sheer number and pace of interest rate hikes aimed at taming it. By contrast, the market declines that accompanied the tech bubble and global financial crisis stemmed from investors’ concerns over the creditworthiness of certain assets, including overvalued technology stocks and excesses in the U.S. housing market.
While volatility could continue to persist in markets, we see potential for it to ease over the coming months as central banks gain a better grasp on the energy situation and inflation, which could start a downward trajectory as we get closer to terminal rates.
Supportive Fundamentals Are Easing, but From High Levels
Corporate fundamentals are broadly strong. Gross leverage has declined to a record low of two times2 earnings before interest, taxes, depreciation and amortization. Meanwhile, in terms of liquidity, the ratio of balance sheet cash to debt sits at around 35%2, which is relatively high compared with history. Interest coverage ratios are also near record highs at levels over nine times2 earnings before interest and taxes, as rebounding earnings after the pandemic combined with low corporate bond yields have made it easier for issuers to meet their interest payments.
However, these supportive fundamental factors are showing early signs of easing, albeit from a high level. The challenging combination of higher input costs and slowing growth momentum could squeeze corporate profit margins and, in turn, be less supportive of future leverage, liquidity and interest coverage ratios. This backdrop underscores the importance of fundamental research and targeted security selection.
Spread Dispersion Creates Potential Opportunities
(Fig. 2) European investment‑grade spreads
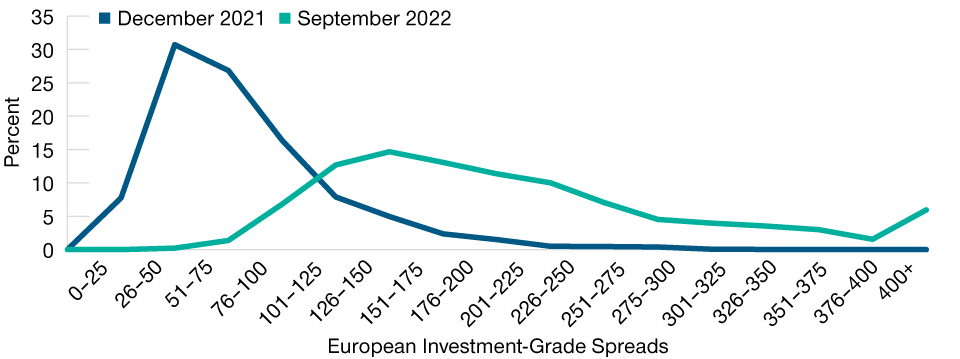
As of 30 September 2022.
Past performance is not a reliable indicator of future performance.
Sources: Bloomberg Euro Aggregate: Corporates Index and T. Rowe Price.
Risks to Watch—Weaker Technical Factors Going Forward
The European Central Bank, via its Corporate Sector Purchase Program (CSPP) and Pandemic Emergency Purchase Program (PEPP), has provided strong technical support to the asset class. However, this unconditional buying has now stopped, and it’s possible that the central bank will commence quantitative tightening in the first quarter of 2023, which could cause more volatility in the asset class.
According to our estimates, the central bank holds about 28% of the total CSPP/PEPP eligible bond universe and about 12% of the broader corporate universe. While this is sizable, we expect any balance sheet reduction that the European Central Bank commences to be gradual as they will want to avoid causing market turmoil. Recent comments from President Christine Lagarde suggest that quantitative tightening will not commence until interest rates have normalized. Furthermore, redemptions from the PEPP will likely continue to be reinvested until at least late 2024, while CSPP reinvestments will likely be reduced gradually in the second half of 2023 in our view.
Increased Spread Dispersion Creates Potential Opportunities for Alpha Generation
The challenging environment has led to increased spread dispersion relative to the start of the year. This creates potential idiosyncratic investment opportunities, in our view, which we can potentially take advantage of with our research and active management. Our approach, which also emphasizes disciplined risk management, has helped the Euro Corporate Bond Composite generate strong risk‑adjusted returns and an information ratio that averages around 1 over the long term on a three‑year rolling basis.
Going forward, we expect opportunities for alpha generation to rise even further as some companies will hold up better than others, creating a divergence in outcomes, both positive and negative, in this difficult environment. Market turbulence may not go away, but we do not think this is something to fear, as volatility creates opportunity. Given attractive valuations and high all‑in yields, we believe we can take advantage of these opportunities; however, we are mindful of several headwinds. Therefore, in‑depth fundamental research and our bottom‑up security selection, coupled within a risk framework, are imperative for managing the challenging times ahead.
Performance
Euro Corporate Bond Composite
Periods Ended 30 September 2022
Figures Are Calculated in Euros

1 Valuations and performance are computed in U.S. dollars and converted to the currency shown. When converting U.S. dollar composite returns, benchmarks, dispersion and/or asset data, the same exchange rate source is used consistently. Total returns in non‑U.S. dollar currencies are calculated by adjusting U.S. dollar performance by the percent change in the U.S. dollar/foreign currency exchange rate (as determined by an independent third party) for the time periods selected.
2 The Value Added row is shown as Euro Corporate Bond Composite (Gross of Fees) minus the benchmark in the third row.
Past performance is not a reliable indicator of future performance.
Gross performance returns are presented before management and all other fees, where applicable, but after trading expenses. Net of fees performance reflects the deduction of the highest applicable management fee that would be charged based on the fee schedule contained within this material, without the benefit of breakpoints. Gross and net performance returns reflect the reinvestment of dividends and are net of all non‑reclaimable withholding taxes on dividends, interest income and capital gains.
Source for Bloomberg index data: Bloomberg Index Services Limited. Please see Additional Disclosures page for information about this Bloomberg information.
GIPS® Composite Report
Euro Corporate Bond Composite
Period Ended 31 December 2021
Figures Are Shown in Euros

1 The fee rate used to calculate net returns is 1.07%. This represents the maximum fee rate applicable to all composite members. Past performance is not a reliable indicator of future performance.
2 Preliminary—subject to adjustment.
T. Rowe Price (TRP) claims compliance with the Global Investment Performance Standards (GIPS®) and has prepared and presented this report in compliance with the GIPS standards. TRP has been independently verified for the 25‑year period ended 30 June 2021 by KPMG LLP. The verification report is available upon request. A firm that claims compliance with the GIPS standards must establish policies and procedures for complying with all the applicable requirements of the GIPS standards. Verification provides assurance on whether the firm’s policies and procedures related to composite and pooled fund maintenance, as well as the calculation, presentation and distribution of performance, have been designed in compliance with the GIPS standards and have been implemented on a firmwide basis. Verification does not ensure the accuracy of any specific composite presentation. TRP is a U.S. investment management firm with various investment advisers registered with the U.S. Securities and Exchange Commission, the U.K. Financial Conduct Authority and other regulatory bodies in various countries and holds itself out as such to potential clients for GIPS purposes. TRP further defines itself under GIPS as a discretionary investment manager providing services primarily to institutional clients with regard to various mandates, which include U.S., international, and global strategies, but excluding the services of the Private Asset Management group. The minimum asset level for equity portfolios to be included in composites is $5 million, and prior to January 2002 the minimum was $1 million. The minimum asset level for fixed income and asset allocation portfolios to be included in composites is $10 million; prior to October 2004 the minimum was $5 million; and prior to January 2002, the minimum was $1 million. Valuations and performance are computed in U.S. dollars and converted to euro. When converting U.S. dollar composite returns, benchmarks, dispersion and asset data, the same exchange rate source is used consistently. Total returns in non‑U.S. dollar currencies are calculated by adjusting U.S. dollar performance by the percent change in the U.S. dollar/foreign currency exchange rate (as determined by an independent third party) for the time periods selected.
Gross performance returns are presented before management and all other fees, where applicable, but after trading expenses. Net of fees performance reflects the deduction of the maximum fee rate applicable to all composite members as shown above. Gross performance returns reflect the reinvestment of dividends and are net of nonreclaimable withholding taxes on dividends, interest income and capital gains. Gross performance returns are used to calculate presented risk measures. Effective 30 June 2013, portfolio valuation and assets under management are calculated based on the closing price of the security in its respective market. Previously, portfolios holding international securities may have been adjusted for after‑market events. Policies for valuing portfolios, calculating performance and preparing compliant presentations are available upon request. Dispersion is measured by the standard deviation across asset‑weighted portfolio returns represented within a composite for the full year. Dispersion is not calculated for the composites in which there are five or fewer portfolios.
Some portfolios may trade futures, options, and other potentially high‑risk derivatives that may create leverage and generally represent in aggregate less than 10% of a portfolio. Benchmarks are taken from published sources and may have different calculation methodologies, pricing times, and foreign exchange sources from the composite.
Composite policy requires the temporary removal of any portfolio incurring a client‑initiated significant cash inflow or outflow greater than or equal to 15% of portfolio assets. The temporary removal of such an account occurs at the beginning of the measurement period in which the significant cash flow occurs and the account reenters the composite on the last day of the current month after the cash flow. Additional information regarding the treatment of significant cash flows is available upon request.
The firm’s list of composite descriptions, a list of limited distribution pooled fund descriptions, and a list of broad distribution pooled funds are available upon request. GIPS® is a registered trademark of CFA Institute. CFA Institute does not endorse or promote this organization, nor does it warrant the accuracy or quality of the content contained herein.
Fee Schedule
Euro Corporate Bond Composite
As of 30 September 2022
The Euro Corporate Bond Composite seeks current income and capital appreciation primarily through investment in corporate fixed income securities denominated in euros. The strategy may invest in preferred stock and other transferable debt securities, including those issued by the governments of countries participating in the euro. (Created June 2001; incepted July 31, 2001.)

1 A transitional credit is applied to the fee schedule as assets approach or fall below the breakpoint.
Risks—The following risks are materially relevant to the portfolio:
Credit—Credit risk arises when an issuer’s financial health deteriorates and/or it fails to fulfill its financial obligations to the portfolio.
Default—Default risk may occur if the issuers of certain bonds become unable or unwilling to make payments on their bonds.
Derivatives—Derivatives may be used to create leverage which could expose the portfolio to higher volatility and/or losses that are significantly greater than the cost of the derivative.
Emerging Markets—Emerging markets are less established than developed markets and therefore involve higher risks.
Interest Rate—Interest rate risk is the potential for losses in fixed-income investments as a result of unexpected changes in interest rates.
Liquidity—Liquidity risk may result in securities becoming hard to value or trade within a desired timeframe at a fair price.
Sector Concentration—Sector concentration risk may result in performance being more strongly affected by any business, industry, economic, financial or market conditions affecting a particular sector in which the portfolio’s assets are concentrated.
Total Return Swap—Total return swap contracts may expose the portfolio to additional risks, including market, counterparty and operational risks as well as risks linked to the use of collateral arrangements.
General Portfolio Risks
Counterparty—Counterparty risk may materialise if an entity with which the portfolio does business becomes unwilling or unable to meet its obligations to the portfolio.
ESG and Sustainability—ESG and Sustainability risk may result in a material negative impact on the value of an investment and performance of the portfolio.
Geographic Concentration—Geographic concentration risk may result in performance being more strongly affected by any social, political, economic, environmental or market conditions affecting those countries or regions in which the portfolio’s assets are concentrated.
Hedging—Hedging measures involve costs and may work imperfectly, may not be feasible at times, or may fail completely.
Investment Portfolio—Investing in portfolios involves certain risks an investor would not face if investing in markets directly.
Management—Management risk may result in potential conflicts of interest relating to the obligations of the investment manager.
Market—Market risk may subject the portfolio to experience losses caused by unexpected changes in a wide variety of factors.
Operational—Operational risk may cause losses as a result of incidents caused by people, systems, and/or processes.
IMPORTANT INFORMATION
This material is being furnished for general informational and/or marketing purposes only. The material does not constitute or undertake to give advice of any nature, including fiduciary investment advice, nor is it intended to serve as the primary basis for an investment decision. Prospective investors are recommended to seek independent legal, financial and tax advice before making any investment decision. T. Rowe Price group of companies including T. Rowe Price Associates, Inc. and/or its affiliates receive revenue from T. Rowe Price investment products and services. Past performance is not a reliable indicator of future performance. The value of an investment and any income from it can go down as well as up. Investors may get back less than the amount invested.
The material does not constitute a distribution, an offer, an invitation, a personal or general recommendation or solicitation to sell or buy any securities in any jurisdiction or to conduct any particular investment activity. The material has not been reviewed by any regulatory authority in any jurisdiction.
Information and opinions presented have been obtained or derived from sources believed to be reliable and current; however, we cannot guarantee the sources' accuracy or completeness. There is no guarantee that any forecasts made will come to pass. The views contained herein are as of the date noted on the material and are subject to change without notice; these views may differ from those of other T. Rowe Price group companies and/or associates. Under no circumstances should the material, in whole or in part, be copied or redistributed without consent from T. Rowe Price.
The material is not intended for use by persons in jurisdictions which prohibit or restrict the distribution of the material and in certain countries the material is provided upon specific request.
It is not intended for distribution to retail investors in any jurisdiction.