
Sixth Annual Defined Contribution Consultant Study
What consultants and advisors see ahead for defined contribution plans.
September 2026, Retirement
Methodology
T. Rowe Price conducted its sixth annual Defined Contribution Consultant Study to capture current views from the defined contribution (DC) consultant and advisor community on a wide range of retirement and investment topics.
- Key findings explore:
- Active/passive/blend preferences
- Expectations regarding DC plan use of private assets
- Diversification opportunities in fixed income
- Innovations in stable value to increase crediting rates
- The expanding universe of target date solutions
- Managed account positioning and their underlying investments
- Retirement income solutions and their relative appeal
- How consultants and advisors are evaluating and/or offering financial wellness programs
- New in 2026, the study takes a deeper look at the evolving role of artificial intelligence (AI) for DC plan consultants and advisors and the rise of co‑manufactured target date solutions.
- Participating in the 2026 study were 36 of the leading consultant and advisor firms representing over 160,000 DC plan sponsor clients and over $10.3T in DC plan assets1, which reflects 72% of the total $14.2T DC plan market2.
- The study was fielded from January 12, 2026, to March 11, 2026.
1 Assets under advisement figures are self‑reported.
2 Source: ICI, as of December 31, 2025.
Respondent firms
Aon | Bellwether Consulting | Callan LLC | Cambridge Associates | CAPTRUST | Cerity Partners | Clearstead | Commonwealth | Curcio Webb | Francis Investment Counsel | Frost Bank | Gallagher Fiduciary Advisors, LLC | Goldman Sachs Asset Management | Gosselin Consulting Group | Higginbotham | Highland Associates | Highland Consulting Associates, Inc. | HUB RPW | Intellicents | LCG Associates, Inc. | Marquette Associates | Marsh McLennan Agency | Meketa Investment Group | Mercer | Morgan Stanley | NEPC, LLC | Newport Group, Inc. | OneDigital | PlanPILOT | Russell Investments | RVK | Segal Marco Advisors | USI | Verus Investments3 | Willis Towers Watson | Wilshire Associates
3Now known as Cerity Partners Institutional Consulting.
-
AI adoption
-
Active/Passive
-
Private assets
-
Stable value
-
CITs and blend TDFs
-
Managed accounts
- Retirement income
- Financial wellness
AI adoption moves from evaluation to basic execution
Key findings
- AI adoption accelerated sharply in 2026. Only 14% of respondent firms described their use of AI as “too early to know, currently evaluating,” compared with 44% in 2025, a 30‑percentage‑point year‑over‑year decrease. (Figure 1)
- Firms report using AI routinely to improve operational efficiency (78%) and streamline client preparation (67%), while adoption remains limited for plan design (12%) and participant engagement and other advice‑oriented activities (9%) where human expertise and fiduciary oversight remain essential. All figures represent daily or weekly use. (Figure 2)
- Firms with formal AI policies used AI roughly 50% more frequently across business functions, suggesting that clear guardrails accelerate use.
(Fig. 1) How consultants/advisors are using AI
Respondents could select all that applied.
(Fig. 2) How frequently firms use AI across key functions
* Operational efficiencies could include email drafting, summarization, workflows, and templates.
Active and passive preferences vary by asset class
Key findings
- Implementation preferences among consultants and advisors vary by asset class; however, there is minimal support for offering only passive options. A mirrored lineup, where asset classes are offered in passive and active options, is most favored for equities, while there is a bias toward active management in fixed income, particularly among sub‑asset classes where credit selection is key. (Figure 3)
- Results suggest that consultants and advisors are taking a holistic approach to investment menu construction by evaluating active and passive strategies based on asset class characteristics.
(Fig. 3) Consultant/advisor implementation preferences by investment strategy
All data points may not add up to 100% due to rounding.
Private assets gain momentum
Key findings
- Consultants’ and advisors’ expectations regarding the potential implementation of private asset investments in DC plans continue to gain momentum, with 2026 responses surpassing 2024 results across all private asset strategies except hedge funds. (Figure 4)
- Anticipation that private credit will be included in DC plan investments—primarily through target date funds—increased dramatically from 2024 to 2026 despite persistent negative headlines. In 2026, private credit received an average likelihood rating of 2.6 on a 1 to 4 scale, where 4 represents the greatest likelihood of being incorporated in DC plans. Although typically less liquid and less transparent than public debt, private credit can offer higher yields than traditional fixed income while enhancing diversification within a professionally managed multi‑asset solution such as a target date fund. (Figure 4)
- Private equity similarly experienced growing implementation expectations, with its average likelihood rating increasing to 2.2 in 2026 from 1.6 in 2024. Cryptocurrency and hedge funds appear least likely to be implemented in DC plans (Figure 4). Notably, three‑quarters (75%) of respondent firms view cryptocurrency as most likely to be available through a self‑directed brokerage window rather than as part of a plan’s core investment lineup. (Figure 5)
- Participants are most likely to gain exposure to private markets through target date funds, off‑the‑shelf or custom. (Figure 5)
(Fig. 4) Likelihood of private asset or alternative investment strategy to be implemented in DC plans (over the next 12–24 months)
Rating: Least likely (1) to most likely (4).
The 2026 survey was fielded from January 12–March 11, 2026, and the 2024 survey was fielded from January 12–March 4, 2024. Cryptocurrency, private infrastructure, and real assets were new options in 2026.
(Fig. 5) Most likely implementation method by private asset or alternative investment strategy
Innovation in stable value
Key findings
- More than half (52%) of respondent firms cited poor performance as influencing their evaluation of capital preservation options; a 33‑percentage‑point increase from five years earlier. Stable value crediting rates have trailed money market fund yields since 2022; however, the gap between the two has narrowed in 2026. (Figure 6)
- This unique period during which stable value has underperformed money market funds has led to increased interest in reviewing/revisiting a plan’s capital preservation options. For example, consultants and advisors report growing interest in transitioning plans from a stable value general account/insurance company product to a pooled fund in an effort to increase the crediting rate. (Figure 7)
- The search for a more competitive crediting rate is also reflected in consultants’ focus on diversification opportunities. For example, in separate account stable value mandates, this can lead to the addition of nontraditional stable value sectors that are typically higher yielding, such as equities, high yield bonds, or private credit. (Figure 6)
(Fig. 6) Trends influencing the evaluation of capital preservation options
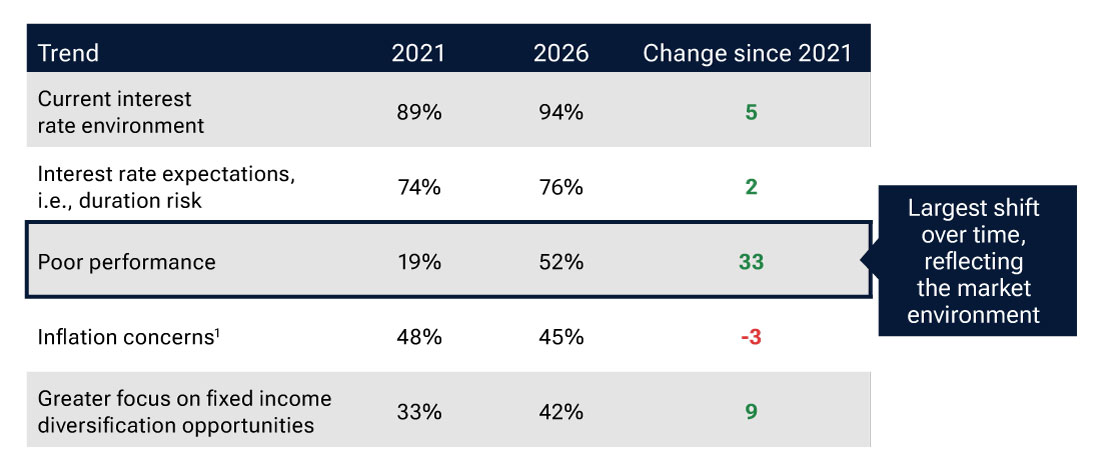
1 Such as seeking inflation mitigation, higher yield to combat deteriorating purchasing power.
(Fig. 7) Expected capital preservation activity in the next 12–18 months
Rating: Strongly disagree (1) to strongly agree (4).
* Not included in 2021 study.
CITs and blend target date funds gaining share
Key findings
- Results show nearly unanimous support for target date solutions offered in collective investment trusts (CITs), consistent with findings over the past five years and market sizing data, where CITs represent more than half (54%) of the total target date market.2 (Figure 8)
- Consultants and advisors also continue to express a strong preference for blend target date solutions that allocate to both active and passive strategies. Respondent firms cite cost effectiveness (71%), ability to leverage market inefficiencies (56%), and optimized performance (41%) as the top factors influencing their support for blend solutions. Collectively, the data reveal that blend target date solutions, which offer participants some of the potential benefits of active management at a typically lower price compared with fully active solutions, represent a compelling solution for consultants and advisors. (Figure 8)
- Co‑manufactured target date funds are gaining meaningful traction, growing to more than $70B in assets as of year‑end 2025, an increase of over 50% from 2024.2 Their combination of cost efficiency/pricing leverage and fiduciary clarity holds the greatest appeal for advisors and consultants. (Figure 9)
(Fig. 8) Consultant and advisor support for key target date solution approaches
Rating: Do not support (1) to strongly support (4).
Gray bars represent the range of responses.
(Fig. 9) Attributes consultants and advisors find appealing in co‑manufactured
target date solutions
Rating: Not appealing (1) to most appealing (4).
Gray bars represent the range of responses.
Delivering personalization through managed accounts
Key findings
- Support for using managed accounts as a qualified default investment alternative (QDIA) remains limited. However, findings reveal modest support for a dynamic QDIA implementation, where participants approaching retirement transition from a target date solution to a managed account program. A dynamic QDIA provides the infrastructure to introduce personalization when participants are most likely to benefit. (Figure 10)
- Despite industry discussion around expanding managed account investment capabilities, most proprietary managed account solutions either do not currently offer allocations to noncore investment options (60%) or do not have the ability to do so (13%). Among respondents with a proprietary managed account that can allocate to funds that are not available on the plan menu, the most common exposure is sub‑asset classes across style and market caps (23%). (Figure 11)
(Fig. 10) Level of support for managed account implementation options
Rating: Do not support (1) to strongly support (4).
(Fig. 11) Noncore menu investment options supported by proprietary managed account solutions (AMAs)
Respondents could select all that applied.
No consensus on retirement income solutions
Key findings
- Consistent with findings from the previous five years of conducting this research, consultants and advisors rate a simple systematic withdrawal capability (3.2) as the most appealing retirement income solution or feature. Despite the growing availability of more complex in‑plan retirement income solutions, this straightforward plan design feature continues to be favored, reflecting plan sponsors’ foremost retirement income objective, which is to help participants convert their retirement plan balances into repeatable and predictable streams of income. (Figure 12)
- A target date fund with a non‑guaranteed, embedded managed payout feature captures the second‑highest average score (2.8) among consultants and advisors in terms of its appeal as a retirement income solution. This product structure also reflects plan sponsors’ desire to recreate a paycheck‑like experience for retired participants, but without the additional operational and fiduciary complexities a guaranteed, insurance solution entails. (Figure 12)
- Managed accounts, with or without a guarantee, capture the third‑highest average rating among respondent firms (2.6). Given the heterogeneous nature of retirees’ preferences and needs, managed accounts can be appealing retirement income solutions as they offer the opportunity to further personalize an individual’s asset allocation. (Figure 12)
(Fig. 12) Level of appeal for retirement income solutions and features
| Solution or feature | Consultants and advisors |
|---|---|
| Simple systematic withdrawal capability | 3.2 |
| Target date fund w/embedded managed payout feature (noninsured) | 2.8 |
| Managed account (with income planning feature, noninsured) | 2.6 |
| Managed account (with guaranteed income component insured) | 2.6 |
| Target date fund w/embedded annuity feature | 2.5 |
| Stable value | 2.4 |
| Stand-alone managed payout investment | 2.4 |
| Annuity portal (access to out-of-plan annuities) | 2.2 |
| Dynamic or dual QDIA | 2.2 |
| An investment that incorporates a partial guarantee | 2.1 |
| In-plan immediate annuity | 1.9 |
| In-plan DIA or QLAC | 1.8 |
| Bond ladder-based investment options | 1.6 |
Rating: Least appealing (1) to most appealing (4).
DIA = deferred income annuity, QLAC = qualified longevity annuity contract.
Financial wellness programs continue to mature
Key findings
- As plan sponsors’ focus broadens to supporting participants’ overall financial well‑being, two‑thirds (66%) of respondent firms report evaluating recordkeeper‑provided financial wellness programs, while more than half (59%) evaluated third‑party programs. Notably, about one‑quarter of respondent firms offer either proprietary (24%) or white‑label (10%) financial wellness programs. (Figure 13)
- While proprietary financial wellness programs are offered under a range of pricing structures, they are increasingly being included as part of a standard retainer, cited by nearly half (47%) of respondent firms in 2026 compared with 29% in 2023.
- Proprietary financial wellness programs vary widely in the capabilities they offer and increasingly extend beyond retirement education. The most commonly included components are retirement planning tools (46%) and budgeting tools (46%). (Figure 14)
(Fig. 13) Approaches to evaluating and providing financial wellness solutions
| Approach | Currently evaluate/provide | Considering |
|---|---|---|
| Evaluate recordkeeper-provided financial wellness solutions | 66% | 13% |
| Evaluate third-party financial wellness solutions | 59% | 13% |
| Offer a proprietary financial wellness solution | 24% | 6% |
| Offer a white-label financial wellness solution | 10% | 6% |
(Fig. 14) Components included in proprietary financial wellness programs
Read related insights

- Feb 2026
- Artificial Intelligence
- Article
Change is here: How to integrate AI into your retirement advisory practice

- Aug 2026
- Fixed Income
- Article
Resetting expectations: Why stable value makes sense in today’s dynamic markets
A destination for all our clients
1 Such as seeking inflation mitigation, higher yield to combat deteriorating purchasing power.
2 Sway Research, The State of the Target Date Market: Year‑End 2025; as of 12/31/2025.
Glossary
Alternatives: Financial assets that do not fall into one of the conventional investment categories, such as stocks, bonds, and cash; can include direct real estate, commodities, private credit, private equity, or hedge funds
Bank loans, floating rate: A form of debt financing common between banks and corporate customers, the total interest rate paid by the issuer is decided by adding (or, in rare cases, subtracting) a spread or margin to a specified base rate, such as the U.S. prime rate, or the London Interbank Offered Rate (LIBOR); the interest rate paid by the issuer is reset at predetermined intervals
Collective investment trust: A group of pooled accounts held by a bank or trust company
Commodities: A strategy that invests in raw materials, primary agricultural products, energy products and/or metals
Core bond: A strategy that includes a broadly diverse set of U.S. bonds including Treasury bonds and corporate bonds
Core plus bond: A strategy that includes core bonds and may be augmented by investments in other market sectors, for example high yield bonds and/or international bonds
Direct real estate: Acquiring an ownership interest directly in a residential or commercial real asset
Global bond: A strategy that invests in U.S. bonds as well as non‑U.S. bonds
Hedge fund: A limited partnership of private investors whose money is pooled and managed by professional fund managers
High yield bond: A strategy that invests in below‑investment grade bonds; involves higher risk of default than investment‑grade bonds and offers investors a higher yield as potential compensation for this additional risk
International bond: A strategy that invests in non‑U.S. bonds; may or may not be hedged to the US dollar
Managed account: In the context of a retirement plan, a managed account is a professional service that manages a participant’s investments based on their financial plan and preferences; a financial expert or investment manager makes investment decisions on behalf of the investor
Money market: Refers to several types of securities including short‑term Treasuries (e.g., T‑bills), certificates of deposit (CDs), commercial paper, repurchase agreements (repos), and money market mutual funds that invest in these instruments.
Multi‑sector: A strategy that may invest opportunistically in various sectors of the market
Private equity: Capital investment made into companies that are not publicly traded
Private credit: Privately negotiated loans between a borrower and a non‑bank lender
Qualified default investment alternative (QDIA): A default investment for defined contribution employer‑sponsored retirement plans
Stable value: A unique asset class available only in corporate and governmental tax‑qualified defined contribution plans, as well as some tuition assistance plans; stable value seeks to offer capital preservation, liquidity, and returns typically higher than other options focused on capital preservation, such as money market funds
Total return: Strategy that pursues capital appreciation as well as current income
Treasury inflation‑protected securities (TIPS): A type of Treasury security issued by the U.S. government indexed to inflation to protect investors from a decline in the purchasing power of their money
Additional Disclosure
For U.S. investors, visit troweprice.com/glossary for definitions of financial terms.
More about this study
Participating firms also receive a quantitative analysis of business strategy‑related questions included in the study, including trends on competition, growth and profitability, and firm‑branded or proprietary retirement solutions.
Interested in participating? Please reach out to your T. Rowe Price representative.
Investment Risks
All investments involve risk, including possible loss of principal. Investing in private companies involves greater risk than investing in stocks of established publicly traded companies. Risks include potential loss of capital, illiquidity, less available information and difficulty in valuating private companies. They are not suitable, nor available, for all investors.
Diversification cannot assure a profit or protect against loss in a declining market.
Active investing may have higher costs than passive investing and may underperform the broad market or passive peers with similar objectives. Passive investing may lag the performance of actively managed peers as holdings are not reallocated based on changes in market conditions or outlooks on specific securities.
Fixed‑income securities are subject to credit risk, liquidity risk, call risk, and interest‑rate risk. As interest rates rise, bond prices generally fall. Investments in high‑yield bonds involve greater risk of price volatility, illiquidity, and default than higher‑rated debt securities. Investments in bank loans may at times become difficult to value and highly illiquid; they are subject to credit risk such as nonpayment of principal or interest, and risks of bankruptcy and insolvency. Because of the nature of private credit there may be heightened risks for investors, such as liquidity risk and credit risk to the underlying borrower and investments involve greater risk of price volatility, illiquidity, and default than higher‑rated debt securities.
CITs are not registered securities.
T. Rowe Price does not sell/underwrite insurance or annuities. Any guarantees are subject to the claims paying ability of the insurer. Costs, features, benefits and risks should be considered before establishing a policy.
Commodities and crypto currency are subject to increased risks such as higher price volatility as well as geopolitical and other risks.
The principal value of target date strategies is not guaranteed at any time, including at or after the target date, which is the approximate year an investor plans to retire. These products typically invest in a broad range of underlying strategies that include asset classes such as stocks, bonds, and short‑term investments and are subject to the risks of different areas of the market. A substantial allocation to equities both prior to and after the target date can result in greater volatility over short‑term horizons. In addition, the objectives of target date strategies typically change over time to become more conservative.
Important Information
The material does not constitute or undertake to give advice of any nature, including fiduciary investment advice. Prospective investors are recommended to seek independent legal, financial, and tax advice before making any investment decision. T. Rowe Price group of companies, including T. Rowe Price Associates, Inc., and/or its affiliates, receive revenue from T. Rowe Price investment products and services.
Any tax‑related discussion contained in this material, including any attachments/links, is not intended or written to be used, and cannot be used, for the purpose of (i) avoiding any tax penalties or (ii) promoting, marketing, or recommending to any other party any transaction or matter addressed herein. Please consult your independent legal counsel and/or tax professional regarding any legal or tax issues raised in this material.
The views contained herein are as of September 2026 and are subject to change without notice; these views may differ from those of other T. Rowe Price associates.
This information is not intended to reflect a current or past recommendation concerning investments, investment strategies, or account types; advice of any kind; or a solicitation of an offer to buy or sell any securities or investment services. The opinions and commentary provided do not take into account the investment objectives or financial situation of any particular investor or class of investor. Please consider your own circumstances before making an investment decision.
Information contained herein is based upon sources we consider to be reliable; we do not, however, guarantee its accuracy.
Past performance is not a reliable indicator of future performance. All investments are subject to market risk, including the possible loss of principal. All charts and tables are shown for illustrative purposes only.
T. Rowe Price Investment Services, Inc., distributor, and T. Rowe Price Associates, Inc., investment adviser.
© 2026 T. Rowe Price. All Rights Reserved. T. ROWE PRICE, INVEST WITH CONFIDENCE, the Bighorn Sheep design, and related indicators (see troweprice.com/ip) are trademarks of T. Rowe Price Group, Inc. All other trademarks are the property of their respective owners. Use does not imply endorsement, sponsorship, or affiliation of T. Rowe Price with any of the trademark owners.
202608‑5781596