
How can investors diversify away from AI?
September 2026, Asset Allocation
- Key Insights
-
- AI infrastructure and hyperscalers account for nearly 60% of the Russell 1000 Growth Index, highlighting concentration in U.S. large-cap growth.
- U.S. small caps and MSCI EAFE Value have limited and almost no direct AI exposure, respectively, making them potential diversification options within global equity portfolios.
- Both areas have delivered strong recent returns and continue to offer healthy earnings growth expectations and relatively attractive forward valuations.
Artificial intelligence remains one of the most promising investment themes in equity markets. But after several years of extraordinary gains, the outlook now warrants a bit more caution.
Hyperscaler free cash flow is declining, more AI spending is being funded with debt, and competition is increasing as cheaper open-source models become more viable. As a result, investors may want to make sure their portfolios are not overly dependent on AI.
Within the U.S., large-cap growth is the clearest area of concentration.
We recently did an analysis using ChatGPT and FactSet to find the approximate AI exposure in various indices. Following the recent Russell reconstitution, AI infrastructure beneficiaries now account for approximately 36% of the Russell 1000 Growth Index. These include semiconductor, memory, networking, electronic design automation, and electrical infrastructure companies.
The reconstitution reduced exposure to the hyperscalers—the mega-cap companies funding much of this investment—but they still account for another 22%. Altogether, nearly 60% of the Russell 1000 Growth Index is highly levered to AI.
U.S. large-cap value has considerably less exposure, but AI is still meaningful. Approximately 12% of the Russell 1000 Value Index consists of hyperscalers, while another 7% is exposed to AI infrastructure.
For investors seeking diversification within the U.S., small caps stand out.
We found that only about 5% of the S&P 600 Small Cap Index is directly exposed to AI infrastructure, and there are no hyperscalers in the index.
There is a logical reason for this. Many of the companies benefiting most from the AI buildout have seen their market capitalizations rise dramatically, eventually becoming too large to remain in the small-cap universe.
Outside the U.S., the picture varies considerably.
Emerging markets have substantial AI exposure. Approximately 36% of the MSCI Emerging Markets Index is tied to AI infrastructure. This exposure is driven primarily by memory stocks, but also includes semiconductor foundries, advanced packaging, server assembly, power management, and other hardware.
The index also includes exposure to Chinese hyperscalers such as Alibaba, Tencent, and Baidu.
Developed markets outside the U.S. look very different.
AI infrastructure exposure is much lower, and there are no hyperscalers. This is particularly true for value stocks. The MSCI EAFE Value Index has almost no direct exposure to AI infrastructure, making it one of the clearest diversification options among major equity indexes.
Importantly, areas with limited AI exposure have still produced strong returns.
Over the year ended August 24, 2026, the MSCI EAFE Value Index returned approximately 29%, while the S&P 600 returned roughly 27%.
Those returns are unlikely to be repeated indefinitely, but both areas continue to have strong fundamental support.
U.S. small-cap earnings are currently expected to grow approximately 19% over the next 12 months, while the S&P 600 price is only about 15 times forward earnings.
EAFE Value earnings growth expectations are more modest, at roughly 9%. But the index price is at an even more attractive valuation of less than 13 times forward earnings.
The bottom line is that AI remains a promising investment theme, and investors should be careful about moving too far away from it.
But rising capital intensity, increasing leverage, and a more competitive landscape suggest that investors also should make sure their portfolios are adequately diversified.
U.S. small-caps and developed-market value stocks are two particularly attractive options. Based on our analysis, both have limited AI exposure while still offering healthy fundamentals and reasonable valuations.
Reflecting this view, our Asset Allocation Committee currently maintains overweight positions in both U.S. small-cap stocks and non-U.S. value equities.
Important Information
This material is provided for informational purposes only and is not intended to be investment advice or a recommendation to take any particular investment action. T. Rowe Price and its associates do not provide tax or legal advice. We encourage you to consult your tax or legal professional for tax or legal questions specific to your situation.
The views contained herein are those of the speakers as of August 2026 and are subject to change without notice; these views may differ from those of other T. Rowe Price associates. The opinions and commentary provided do not take into account the investment objectives or financial situation of any particular investor or class of investor. Please consider your own circumstances before making an investment decision.
All investments are subject to market risk, including the possible loss of principal. All charts and tables are shown for illustrative purposes only.
Advisory services are offered by T. Rowe Price Advisory Services, Inc., a registered investment adviser under the Investment Advisers Act of 1940.
Issued by T. Rowe Price Investment Services, Inc., distributor and T. Rowe Price Associates, Inc., investment adviser. T. Rowe Price Investment Services, Inc., T. Rowe Price Associates, Inc., and T. Rowe Price Advisory Services, Inc., are affiliated companies.
© 2026 T. Rowe Price. All Rights Reserved. T. ROWE PRICE, INVEST WITH CONFIDENCE, the Bighorn Sheep design, and related indicators (see troweprice.com/ip) are trademarks of T. Rowe Price Group, Inc.
202609-5873866
How can investors diversify away from AI?
AI remains one of the most promising investment themes in equity markets. However, after several years of extraordinary gains, the outlook now warrants a bit more caution.
Hyperscaler free cash flow is declining, more AI spending is being funded with debt, and competition is increasing as cheaper open‑source models become more viable. As a result, investors may want to make sure their portfolios are not overly dependent on AI.
U.S. exposure is highly concentrated
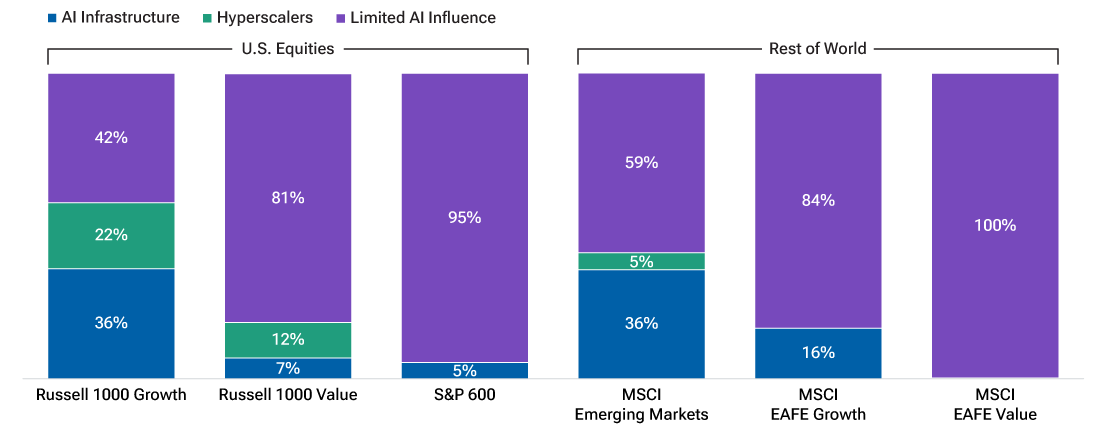
Within the U.S., large‑cap growth is the clearest area of concentration. We recently did an analysis using ChatGPT and FactSet to find the approximate AI exposure in various indices. Following the recent Russell reconstitution, AI infrastructure beneficiaries now account for approximately 36% of the Russell 1000 Growth Index (see Figure 1). These include semiconductor, memory, networking, electronic design automation, and electrical infrastructure companies.
Within the U.S., large‑cap growth is the clearest area of concentration.
AI exposure by region, style, and capitalization
(Fig. 1) Approximate AI exposure by index
Data as of July 31, 2026.
Exposure determined based on ChatGPT using T. Rowe Price analysis of industry structures, and sell‑side and index data sourced from FactSet Research Systems Inc. All rights reserved.
ChatGPT is an AI-based model. AI is subject to potential limitations including potential for inaccuracies, biases and hallucinations. The exposures shown have not been verified. Limited AI influence refers to companies with indirect or relatively low exposure to AI-related demand or activity.
The reconstitution reduced exposure to the hyperscalers—the mega‑cap companies funding much of this investment—but they still account for another 22%. Altogether, nearly 60% of the Russell 1000 Growth Index is highly levered to AI.
U.S. large‑cap value has considerably less exposure, but AI is still meaningful. Approximately 12% of the Russell 1000 Value Index consists of hyperscalers, while another 7% is exposed to AI infrastructure.
For investors seeking diversification within the U.S., small‑caps stand out. We found that only about 5% of the S&P 600 SmallCap Index is directly exposed to AI infrastructure, and there are no hyperscalers in the index. There is a logical reason for this. Many of the companies benefiting most from the AI build‑out have seen their market capitalizations rise dramatically, eventually becoming too large to remain in the small‑cap universe.
Outside the U.S., emerging markets are AI‑heavy
Outside the U.S., the picture varies considerably. Emerging markets have substantial AI exposure. Approximately 36% of the MSCI Emerging Markets Index is tied to AI infrastructure. This exposure is driven primarily by memory stocks, but also includes semiconductor foundries, advanced packaging, server assembly, power management, and other hardware. The index also includes exposure to Chinese hyperscalers such as Alibaba, Tencent, and Baidu.
Developed markets outside the U.S. look very different. AI infrastructure exposure is much lower, and there are no hyperscalers. This is particularly true for value stocks. The MSCI EAFE Value Index has almost no direct exposure to AI infrastructure, making it one of the clearest diversification options among major equity indexes.
Strong performance without significant AI exposure
(Fig. 2) Total returns, one year ending 8/24/26
Data as of August 24, 2026.
Past performance is not a guarantee or a reliable indicator of future results.
Source: T. Rowe Price analysis using data from FactSet Research Systems Inc. All rights reserved.
For office use only: 2202609-5931102
Diversification has not meant sacrificing returns
Importantly, areas with limited AI exposure have still produced strong returns. Over the year ended August 24, 2026, the MSCI EAFE Value Index returned approximately 29%, while the S&P 600 SmallCap Index returned roughly 27% (see Figure 2). Those returns are unlikely to be repeated indefinitely, but both areas continue to have strong fundamental support.
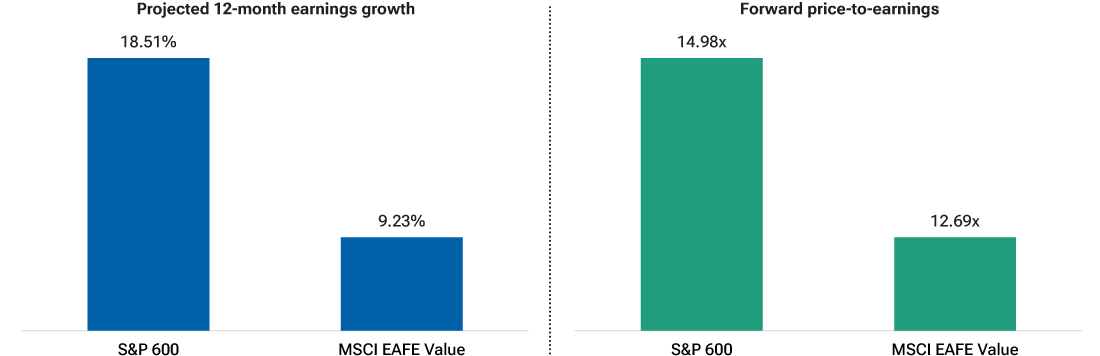
U.S. small‑cap earnings are currently expected to grow approximately 19% over the next 12 months, while the S&P 600 SmallCap Index price is only about 15 times forward earnings. EAFE Value earnings growth expectations are more modest, at roughly 9%. But the index price is at an even more attractive valuation of less than 13 times forward earnings (see Figure 3).
(Fig. 3) Healthy earnings growth expectations and attractive valuations
Data as of August 24, 2026.
For illustrative purposes only. Actual outcomes may differ materially from estimates. Indices cannot be invested into directly.
Source: T. Rowe Price analysis using data from FactSet Research Systems Inc. All rights reserved. Chart shows consensus estimates.
Conclusion
The bottom line is that AI remains a promising investment theme, and investors should be careful about moving too far away from it. But rising capital intensity, increasing leverage, and a more competitive landscape suggest that investors also should make sure their portfolios are adequately diversified.
The bottom line is that AI remains a promising investment theme, and investors should be careful about moving too far away from it.
U.S. small‑caps and developed‑market value stocks are two particularly attractive options. Based on our analysis, both have limited AI exposure while still offering healthy fundamentals and reasonable valuations. Reflecting this view, our Asset Allocation Committee currently maintains overweight positions in both U.S. small‑cap stocks and non‑U.S. value equities.
 Timothy C. Murray, CFA
Capital Markets Strategist
Timothy C. Murray, CFA
Capital Markets Strategist

- Aug 2026
- Asset Allocation
- Article
Why we have become more constructive on equities
Risks:
International investments can be riskier than U.S. investments due to the adverse effects of currency exchange rates, differences in market structure and liquidity, as well as specific country, regional, and economic developments. These risks are generally greater for investments in emerging markets.
Growth stocks are subject to the volatility inherent in common stock investing, and their share price may fluctuate more than that of income‑oriented stocks.
The value approach to investing carries the risk that the market will not recognize a security’s intrinsic value for a long time or that a stock judged to be undervalued may actually be appropriately priced.
Small‑cap stocks have generally been more volatile in price than large‑cap stocks.
Diversification cannot assure a profit or protect against loss in a declining market.
Investing in technology stocks entails specific risks, including the potential for wide variations in performance and usually wide price swings, up and down. Technology companies can be affected by, among other things, intense competition, government regulation, earnings disappointments, dependency on patent protection and rapid obsolescence of products and services due to technological innovations or changing consumer preferences.
The securities identified and described are for informational purposes only and do not represent recommendations.
Additional Disclosures
For U.S. investors, visit troweprice.com/glossary for definitions of financial terms.
Please see vendor indices for more information, including definitions and source data: troweprice.com/marketdata.
Important Information
This material is being furnished for informational and/or marketing purposes only and does not constitute an offer, recommendation, advice, or solicitation to sell or buy any security.
Prospective investors should seek independent legal, financial and tax advice before making any investment decision. T. Rowe Price group of companies including T. Rowe Price Associates, Inc. and/or its affiliates receive revenue from T. Rowe Price investment products and services.
Past performance is not a guarantee or a reliable indicator of future results. All investments involve risk, including possible loss of principal.
Information presented has been obtained from sources believed to be reliable, however, we cannot guarantee the accuracy or completeness. The views contained herein are those of the author(s), are as of September 2026, are subject to change, and may differ from the views of other T. Rowe Price Group companies and/or associates. Under no circumstances should the material, in whole or in part, be copied or redistributed without consent from T. Rowe Price.
All charts and tables are shown for illustrative purposes only. Actual future outcomes may differ materially from any estimates or forward‑looking statements provided. Index performance is for illustrative purposes only and is not indicative of any specific investment. Investors cannot invest directly in an index.
The material is not intended for use by persons in jurisdictions which prohibit or restrict the distribution of the material and in certain countries the material is provided upon specific request.
Issued in the USA by T. Rowe Price Investment Services, Inc., distributor and T. Rowe Price Associates, Inc., investment adviser, 1307 Point Street, Baltimore, MD 21231, which are regulated by the Financial Industry Regulatory Authority and the U.S. Securities and Exchange Commission, respectively.
© 2026 T. Rowe Price. All Rights Reserved. T. Rowe Price, INVEST WITH CONFIDENCE, the Bighorn Sheep design, and related indicators (see troweprice.com/ip) are trademarks of T. Rowe Price Group, Inc. All other trademarks are the property of their respective owners. Use does not imply endorsement, sponsorship, or affiliation of T. Rowe Price with any of the trademark owners.
- 202609‑5873888