


Asset Allocation
- U.S. Equities Are Back in Favor
- 2023-07-10 16:19
- Key Insights
-
- Tailwinds that have boosted equities outside the U.S.—including low energy prices in Europe and the post-COVID reopening in China—are expected to fade.
- Given the improved earnings outlook for U.S. companies, our Asset Allocation Committee recently increased the allocation to U.S. stocks from underweight to neutral.
From late 2022 into 2023, non‑U.S. equities—especially in Europe and China—significantly outpaced U.S. stocks. However, the tailwinds that drove outperformance in those regions may be peaking. Meanwhile, U.S. company earnings have rebounded after an extended period of deterioration. The gap in their performance relative to other global equities has narrowed by more than half (Figure 1).
U.S. Equities Bounce Back
(Fig. 1) U.S. equities vs. the rest of the world
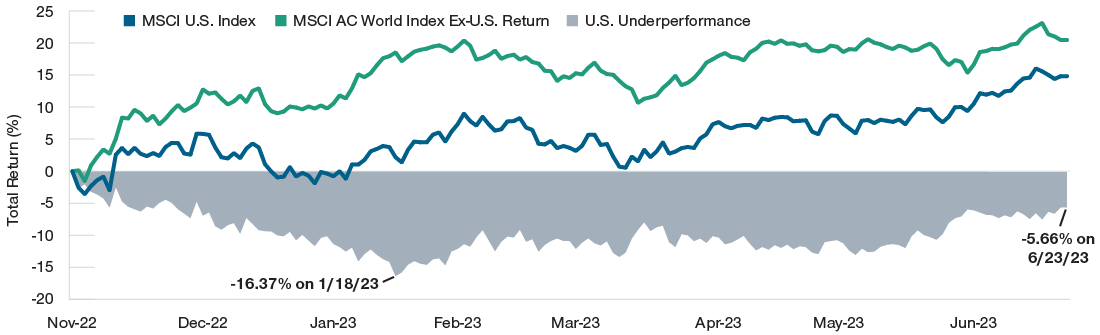
November 1, 2022, through June 22, 2023.
Past performance is not a reliable indicator of future performance.
Sources: T. Rowe Price analysis using data from FactSet Research Systems Inc. All rights reserved. MSCI Indexes. See Additional Disclosures.
U.S. Growth Stocks Earnings Estimates Have Inflected Higher
(Fig. 2) Earnings outlook for U.S. growth stocks
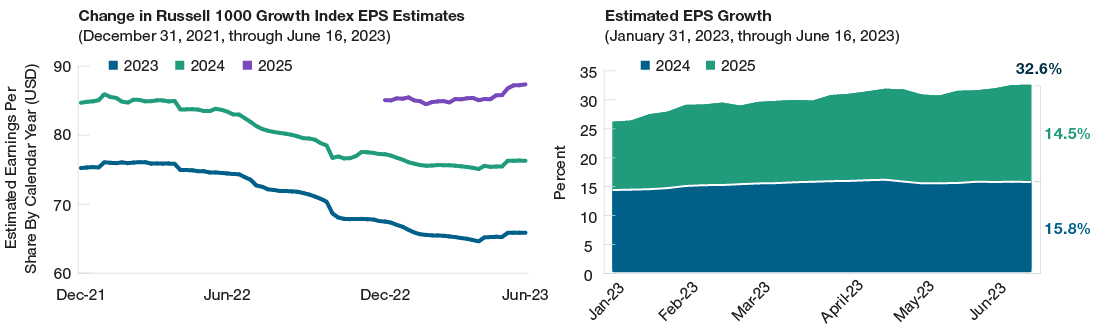
Actual outcomes may differ materially from estimates. Estimates are subject to change.
Sources: T. Rowe Price analysis using data from FactSet Research Systems Inc. All rights reserved. FTSE/Russell Indexes. See Additional Disclosures.
European stocks rallied in early 2023, supported by sharply lower energy prices amid an unseasonably warm winter. But this price relief is likely to reverse as energy demand increases during the summer months. Colder temperatures in the coming 2023–2024 winter season also could boost energy consumption.
In China, robust economic activity driven by the post-COVID reopening appears to have faded, and stimulus measures to shore up economic weakness are unlikely to match prior levels given the government’s focus on financial deleveraging and ensuring that the benefits of economic growth are shared more widely.
Meanwhile, despite looming headwinds, the U.S. economy has remained resilient, and the U.S. earnings outlook is trending positive (Figure 2). U.S. growth stocks, technology stocks in particular, have been boosted by recent developments in artificial intelligence. Companies in the U.S. industrials sector also have benefited from higher demand spurred by the Creating Helpful Incentives to Produce Semiconductors (CHIPS) and Science Act, the Inflation Reduction Act, and corporate reshoring.
Notably, valuations for U.S. stocks far exceed other global stocks. However, this valuation gap can be justified by differences in company profitability. U.S. stocks are more expensive because they have enjoyed a sizable advantage in profitability—a gap that has been expanding gradually for nearly 15 years.
Given this improved outlook for U.S. stocks, our Asset Allocation Committee moved its allocation to U.S. stocks from underweight to neutral relative to the rest of the world.
Get insights from our experts.
Subscribe to get email updates including article recommendations relating to asset allocation.
-
Additional Disclosures
MSCI and its affiliates and third party sources and providers (collectively, “MSCI”) makes no express or implied warranties or representations and shall have no liability whatsoever with respect to any MSCI data contained herein. The MSCI data may not be further redistributed or used as a basis for other indices or any securities or financial products. This report is not approved, reviewed, or produced by MSCI. Historical MSCI data and analysis should not be taken as an indication or guarantee of any future performance analysis, forecast or prediction. None of the MSCI data is intended to constitute investment advice or a recommendation to make (or refrain from making) any kind of investment decision and may not be relied on as such.
London Stock Exchange Group plc and its group undertakings (collectively, the “LSE Group”). © LSE Group 2023. All rights in the FTSE Russell indexes or data vest in the relevant LSE Group company which owns the index or the data. Neither LSE Group nor its licensors accept any liability for any errors or omissions in the indexes or data and no party may rely on any indexes or data contained in this communication. No further distribution of data from the LSE Group is permitted without the relevant LSE Group company’s express written consent. The LSE Group does not promote, sponsor or endorse the content of this communication.
CFA® and Chartered Financial Analyst® are registered trademarks owned by CFA Institute.
Important Information
This material is provided for informational purposes only and is not intended to be investment advice or a recommendation to take any particular investment action.
The views contained herein are those of the authors as of June 31, 2023 and are subject to change without notice; these views may differ from those of other T. Rowe Price associates.
This information is not intended to reflect a current or past recommendation concerning investments, investment strategies, or account types, advice of any kind, or a solicitation of an offer to buy or sell any securities or investment services. The opinions and commentary provided do not take into account the investment objectives or financial situation of any particular investor or class of investor. Please consider your own circumstances before making an investment decision.
Information contained herein is based upon sources we consider to be reliable; we do not, however, guarantee its accuracy. Actual future outcomes may differ materially from any estimates or forward-looking statements made.
Past performance is not a reliable indicator of future performance. All investments are subject to market risk, including the possible loss of principal. Growth stocks are subject to the volatility inherent in common stock investing, and their share price may fluctuate more than that of a income-oriented stocks. Investing in technology stocks entails specific risks, including the potential for wide variations in performance and usually wide price swings, up and down. All charts and tables are shown for illustrative purposes only.
T. Rowe Price Investment Services, Inc.
© 2023 T. Rowe Price. All Rights Reserved. T. ROWE PRICE, INVEST WITH CONFIDENCE, and the Bighorn Sheep design are, collectively and/or apart, trademarks of T. Rowe Price Group, Inc.
202307-3005316