


Personal Finance
Optimizing Your Portfolio Allocation
There’s no single long-term investment that will both safeguard your portfolio from market volatility and provide the growth potential needed to achieve your goals. Instead, investors typically rely on a healthy mix of diversified investments or an asset allocation strategy.
You shouldn’t have to choose between a strong defense and strong offense
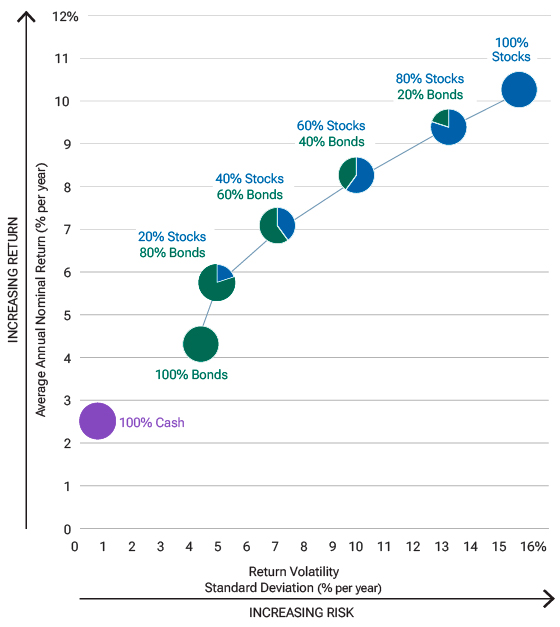
Bonds are prized for their durability and predictability, as they tend to generate less return volatility than stocks, long term. On the other hand, stocks have the potential to generate much higher absolute returns than bonds, generally speaking. The charts below show that, historically, a portfolio that has a mix of both stocks and bonds generated higher returns than an all-bond or all-cash portfolio with less risk (as measured by volatility) than an all-stock portfolio. Working with a financial professional to confirm the asset allocation that’s right for you, based on your time horizon and risk tolerance, can help you achieve the right balance between capital protection and growth.
ASSET ALLOCATION HAS A BIG IMPACT ON PERFORMANCE
30 Years Ended December 31, 2023
PORTFOLIO PERFORMANCE
30 Years Ended December 31, 2023
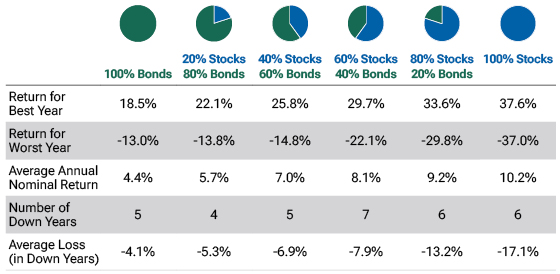
These hypothetical portfolios combine stocks and bonds to represent a range of potential risk/reward profiles. For each allocation model, historical data are shown to represent how the portfolios would have fared in the past. Figures include changes in principal value and reinvested dividends and assume the portfolios are rebalanced monthly. It is not possible to invest directly in an index. Past performance cannot guarantee future results.
Charts are shown for illustrative purposes only and do not represent the performance of any specific security or T. Rowe Price product.
Sources: T. Rowe Price, created with Zephyr StyleADVISOR; S&P; Bloomberg Index Ltd.; and FTSE. See Additional Disclosures. Stocks, S&P 500 Index; bonds, Bloomberg U.S. Aggregate Bond Index; cash, FTSE 3-Month U.S. Treasury Bill.
Important Information:
This material is provided for informational purposes only and is not intended to be investment advice or a recommendation to take any particular investment action. This information is not intended to reflect a current or past recommendation concerning investments, investment strategies, or account types; advice of any kind; or a solicitation of an offer to buy or sell any securities or investment services. The opinions and commentary provided do not take into account the investment objectives or financial situation of any particular investor or class of investor. Please consider your own circumstances before making an investment decision.
© 2024 T. Rowe Price. All Rights Reserved. T. ROWE PRICE, INVEST WITH CONFIDENCE, and the Bighorn Sheep design are, collectively and/or apart, trademarks of T. Rowe Price Group, Inc. T. Rowe Price Investment Services, Inc.
Investment products are:
NOT FDIC-INSURED | NO BANK GUARANTEE | MAY LOSE VALUE
202404-3481459