
November 2023 / GLOBAL FIXED INCOME
Avoiding false signals in wait for peak U.S. Treasury yields
A framework can be useful for evaluating whether U.S. Treasury yields have peaked.
The number one question—in fact, maybe the only question—that clients are asking me at the moment is, “Did I miss the top in yields?” My answer is, probably not.
As readers of this blog will know, one of my highest-conviction views over the last few months has been for higher global government bond yields. This has come to fruition, but in the last couple of weeks we have seen a violent counter-trend rally.
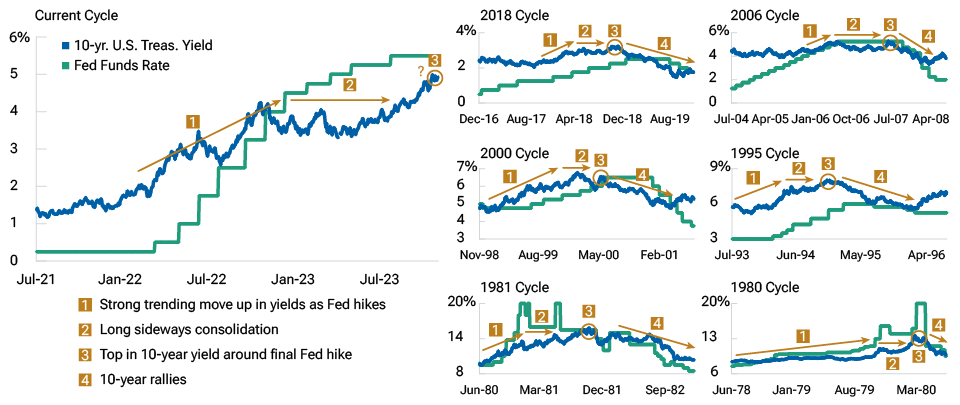
The sell-off in longer-maturity rates began in, roughly, late summer and saw the 10-year U.S. Treasury yield briefly reach 5.00% in October. We saw this sell-off coming as a final “blow-off” move higher in yields—the phase three in the framework we defined in “The Four U.S. Treasury Yield Phases of a Fed Tightening Cycle.” Our internal discussions have centered on whether phase three has ended and whether we are moving into phase four—the transition to a rapid decrease in yields. Again, the answer is, probably not—we are likely still in phase three.
Yields have tended to peak within four months on either side of final hike
One argument against this and in favor of phase four is that in previous Federal Reserve (Fed) hiking cycles, yields tended to peak within four months on either side of the final rate increase. With the Fed’s most recent hike in late July currently looking like its last, the clock could already be ticking on yields peaking. Will history repeat itself? Or does the very different starting point in terms of yield curve shape, ongoing quantitative tightening, a large fiscal deficit, and volatile global geopolitics make the Fed’s signal less reliable this time?
For the short end of the yield curve, we would argue to continue to focus on the Fed. For the long end, other factors may be more important. Put simply, expect a steeper yield curve.
With that said, there is active debate among our portfolio managers about the indicators that we should look for when determining whether we’ve seen the peak in yields and are indeed in phase three. Some managers are waiting to add duration until the point where market pricing of the Fed’s rate path fully reflects the Fed’s projections—in mid‑November, federal funds futures showed that investors expected about four cuts of 25 basis points each in 2024, while the Fed’s latest forecast anticipated only two rate cuts.
A framework for adding duration
I favor waiting to add U.S. duration until at least one of the following four criteria are met, which I think indicates the transition to phase four—a meaningful rally in rates—is imminent.
- Valuation: At a minimum, the 10-year U.S. Treasury note yields more than the terminal fed funds rate so that the yield curve is not inverted. At that point, there may not necessarily be a good reason to be long duration, but at least one of the strongest reasons to be short lessens. In other words, I would need to see a flat yield curve—if not positively sloped—to consider adding duration. But I would advise against making large positioning changes based on the valuation trigger alone.
We are approaching this guidepost, but the issue is that we don’t know for sure that 5.25%–5.50% is the peak fed funds target range. Nor do we know that merely a flat yield curve is sufficient—in light of the global demand for capital and crowding out of supply, it will depend on the extent that other high-quality global curves steepen. (As an aside, the UK and European yield curves have been steepening quicker than the U.S.) - Time: The European Central Bank (ECB) announces that it will quicken the pace of its asset purchase program (APP) runoff (a form of quantitative tightening) and the Bank of Japan (BoJ) finally exits its yield curve control (YCC) program completely. The idea here is to remove the final distortions in the demand/supply dynamic and essentially allow the market to find its clearing price naturally. The ECB has been backing off the APP runoff as Italian yields have threatened to break out, but the BoJ seems to be slowly and quietly edging to something close to fully ending YCC.
- Systemic events: The Fed abandons quantitative tightening, most likely because the banking system is showing severe stress again. If this happens, I would favor being an immediate buyer of long duration. Other systemic events, such as another sovereign debt crisis in the eurozone periphery, could also be a trigger to add duration.
- Fiscal: Major developed market governments take concrete measures to restrain spending, moderating their need to issue more debt. The Liz Truss debacle in the UK should have educated politicians that they can’t spend out of a budget crisis, but unfortunately not all politicians believe that the rules apply to them. We’ll monitor the messages from politicians regarding fiscal discipline as electioneering starts in earnest.
Expect fleeting rallies before rates peak
I have been fully expecting some rallies that temporarily push yields lower as we wait for our indicators that we’ve reached a peak in rates to turn green. While these yield decreases could be meaningful and enticing, I anticipate waiting for one of these signposts to appear before I would advise strategically adding duration.
Also, I am convinced that yield curve segmentation will lead to most of the eventual rally in duration taking place at the shorter end of the yield curve. Given the recent tightening of financial conditions, growth is likely to slow, benefiting shorter maturities. But the flood of upcoming longer-term government debt supply will probably keep yields at the long end of the curve more elevated. So whether or not we have seen the peak in yields, yield curves will steepen over time in a move that could be led by either end of the curve.
Yields peaking—history rhyming?
(Fig. 1) Four yield phases in historical hiking cycles
As of October 31, 2023. Past results are not a reliable indicator of future results.
Source: Bloomberg Finance L.P. Please see Additional Disclosures page for information.
IMPORTANT INFORMATION
This material is being furnished for general informational and/or marketing purposes only. The material does not constitute or undertake to give advice of any nature, including fiduciary investment advice, nor is it intended to serve as the primary basis for an investment decision. Prospective investors are recommended to seek independent legal, financial and tax advice before making any investment decision. T. Rowe Price group of companies including T. Rowe Price Associates, Inc. and/or its affiliates receive revenue from T. Rowe Price investment products and services. Past performance is not a reliable indicator of future performance. The value of an investment and any income from it can go down as well as up. Investors may get back less than the amount invested.
The material does not constitute a distribution, an offer, an invitation, a personal or general recommendation or solicitation to sell or buy any securities in any jurisdiction or to conduct any particular investment activity. The material has not been reviewed by any regulatory authority in any jurisdiction.
Information and opinions presented have been obtained or derived from sources believed to be reliable and current; however, we cannot guarantee the sources’ accuracy or completeness. There is no guarantee that any forecasts made will come to pass. The views contained herein are as of the date written and are subject to change without notice; these views may differ from those of other T. Rowe Price group companies and/or associates. Under no circumstances should the material, in whole or in part, be copied or redistributed without consent from T. Rowe Price.
The material is not intended for use by persons in jurisdictions which prohibit or restrict the distribution of the material and in certain countries the material is provided upon specific request. It is not intended for distribution to retail investors in any jurisdiction.
November 2023 / INVESTMENT INSIGHTS

Arif Husain is the head of Global Fixed Income and chief investment officer of the Fixed Income Division. He is chairman of the Fixed Income Steering Committee and a member of the firm’s Management Committee. Arif is lead portfolio manager for the Global Government Bond High Quality Strategy. He is a vice president of T. Rowe Price Group, Inc., and T. Rowe Price International Ltd.