
September 2023 / MARKETS & ECONOMY
Central Banks Should Be Wary of Quantitative Overtightening
They may not fully understand its impact.
Central banks have been shrinking their balance sheets for some time. The Bank of England (BoE), European Central Bank (ECB), and Federal Reserve (Fed) have all engaged in some form of quantitative tightening (QT) over the past year. To reduce government debt on their balance sheets, several central banks are either not reinvesting maturing bonds or, in the case of the BoE, actively selling them.
Based on their experiences so far in administering QT, central banks seem to be increasingly confident that they can shrink their balance sheets without disrupting financial markets. As a result, some of them, such as the ECB and BoE, are now likely to accelerate their QT programs. I worry that their confidence is misplaced and that they are at risk of overtightening monetary policy.
The Precise Impact of QE Is Difficult to Measure
Although bond markets have sold off while QT has been administered, this generally has been put down to higher expected policy interest rates rather than the QT itself. However, disentangling the effects of QT from policy rate expectations is not an exact science, especially when yield curves move as much as during the last year. The fact is, we do not really know what level bond yields would have reached today in the absence of QT.
Indeed, current estimates of the impact of QT vary widely, ranging from 10 basis points (bps) (from BoE surveys of market participants) to as large as 60 to 70 bps (from the ECB). Our own approach, which reverse‑engineers QT estimates from standard quantitative easing (QE) vector autoregression models, suggests numbers somewhere in the middle of that range.
The lack of more precise QT estimates should perhaps not be surprising because the effects of QE are not well understood either despite a decade of research. Indeed, the recent House of Lords report titled “QE: A dangerous addiction?” asked the BoE for more research on this topic. The fact that QT as a policy has only been around for a short period of time makes estimation of QT effects even more difficult than those of QE.
Spillover Effects Are Much Stronger at the Long End of the Curve
(Fig. 1) Two‑year vs. 10‑year bund rolling beta to US Treasuries
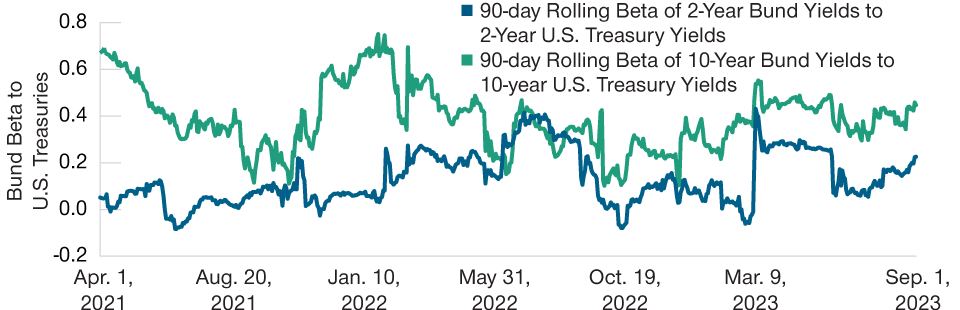
As of September 1, 2023.
Note: Beta (the spillover coefficient) is the contemporaneous 90‑day rolling regression coefficient of the daily changes in the 2‑year/10‑year bund yields on the daily changes in the 2‑year/10‑year US Treasury yields, respectively.
Source: Bloomberg Finance L.P., analysis by T. Rowe Price.
The midrange of current estimates, 35 bps, does not seem like a particularly large impact and would appear to support the widely held view that once QT is announced and priced by markets, its implementation will not raise bond yields further. However, there are two reasons to believe that the effects of QT may go beyond the initial announcement effect and that the policy can exert upward pressure on yields even at the implementation stage. The first of these relates to the fact that the impact of QT on yield curves may take some time to work through; the second relates to the spillover effects of QT across countries. Let’s take each in turn.
The Yield Curve Impacts of QT May Be Delayed
It is important to remember that QT is not being implemented in isolation, but in an environment of high government deficits. After the global financial crisis, high public deficits did not have a significant effect on yields because QE limited the net amount of bonds needed to be absorbed by the private sector. It is different this time. Central bank policies are raising the amount of net debt governments need to sell to the private sector.
While modern finance theory argues that net supply does not impact bond yields, that theory applies to normal times—not the times we live in. For example, the share of German bunds available for private sector purchase has fallen from 72% in 2011 to around 40% now. Such a high degree of public sector ownership has similar effects to financial repression: Yields are likely lower than where they would be if the private sector owned more government debt. Raising the share of private sector participants in this environment as QT is implemented will likely lead to a higher yield on bunds.
Yield curve term premia—the component of the yield curve that investors require to compensate them for interest rate risk in holding long‑term government debt—collapsed when QE began. This is not surprising as central bank QE is the presence of a price‑insensitive buyer in the market, which reduces uncertainty about the future path of long‑dated government bond yields. Yield curve term premia should return because of QT; however, this may happen only once central banks have sold off a significant share of their sovereign debt holdings. In that sense, yields could sell off rapidly toward the end of the policy.
Spillovers Could Amplify the Effect of QT
International spillovers will likely amplify the effect of QT. The spillover of 10‑year US Treasuries on 10‑year bunds is much higher than the corresponding effect for two‑year government debt. This is not surprising since the exchange rate is likely less of a release valve at the long end of the yield curve. Indeed, our estimates suggest that 40% of a move at the long end of the curve spills over across countries, while this figure was only 13% at the short end of the curve (Figure 1). When calculating the total impact of QT on an individual country, these international spillovers need to be considered because many central banks are pursuing QT at the same time.
The Availability of US Treasuries Has Widened the Spread to Bunds
(Fig. 2) Treasury/bund free float vs. Treasury/bund 10‑year real rate differential
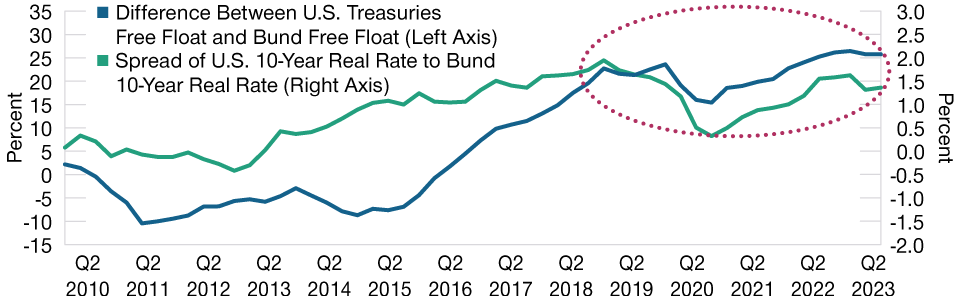
As of June 30, 2023.
Note: The free float is calculated as the share of government debt not owned by
either domestic or foreign public sector authorities.
Sources: IMF, Bloomberg Finance L.P., analysis by T. Rowe Price.
And these are not the only spillover effects to consider—bond net supply effects are likely to matter across countries as well. Normally, the share of bonds available to private sector investors in one bond market versus another has little effect on the real interest rate spread between these two markets. However, this clearly has changed since the pandemic: The 10‑year real interest rate differential between US Treasuries and bunds has widened because the available share of US Treasuries to private investors is so much higher (Figure 2). The more net debt of US Treasuries is out there, the higher the spread to the bund.
The higher US net supply is a function of the Federal Reserve’s QT and loose US fiscal policy. US 10‑year real rate yields will therefore likely remain higher for some time to come as a result of these bond supply effects and will also likely spill over on to other bond markets over time.
In aggregate, these impacts suggest that QT could result in long‑term interest rates that are 50 to 100 bps higher than in the absence of this policy. Usually, between 100 and 150 bps of conventional monetary policy would be required to achieve such an outcome. This clearly shows that the effects of QT are unlikely to be small and that central banks should take time to fully understand them before they accelerate their tightening programs.
T. Rowe Price cautions that economic estimates and forward‑looking statements are subject to numerous assumptions, risks, and uncertainties, which change over time. Actual outcomes could differ materially from those anticipated in estimates and forward‑looking statements, and future results could differ materially from historical performance. The information presented herein is shown for illustrative, informational purposes only. Any historical data used as a basis for analysis are based on information gathered by T. Rowe Price and from third‑party sources and have not been verified. Forecasts are based on subjective estimates about market environments that may never occur. Any forward‑looking statements speak only as of the date they are made. T. Rowe Price assumes no duty to, and does not undertake to, update forward‑looking statements.
IMPORTANT INFORMATION
This material is being furnished for general informational and/or marketing purposes only. The material does not constitute or undertake to give advice of any nature, including fiduciary investment advice, nor is it intended to serve as the primary basis for an investment decision. Prospective investors are recommended to seek independent legal, financial and tax advice before making any investment decision. T. Rowe Price group of companies including T. Rowe Price Associates, Inc. and/or its affiliates receive revenue from T. Rowe Price investment products and services. Past performance is not a reliable indicator of future performance. The value of an investment and any income from it can go down as well as up. Investors may get back less than the amount invested.
The material does not constitute a distribution, an offer, an invitation, a personal or general recommendation or solicitation to sell or buy any securities in any jurisdiction or to conduct any particular investment activity. The material has not been reviewed by any regulatory authority in any jurisdiction.
Information and opinions presented have been obtained or derived from sources believed to be reliable and current; however, we cannot guarantee the sources’ accuracy or completeness. There is no guarantee that any forecasts made will come to pass. The views contained herein are as of the date written and are subject to change without notice; these views may differ from those of other T. Rowe Price group companies and/or associates. Under no circumstances should the material, in whole or in part, be copied or redistributed without consent from T. Rowe Price.
The material is not intended for use by persons in jurisdictions which prohibit or restrict the distribution of the material and in certain countries the material is provided upon specific request. It is not intended for distribution to retail investors in any jurisdiction.
September 2023 / MARKETS & ECONOMY

Tomasz Wieladek is the chief European economist in the Fixed Income Division in London. Tomasz is a vice president of T. Rowe Price Group, Inc.