February 2022 / INVESTMENT INSIGHTS
Another PULSe Indicator Spike in Q4 2021
But the factor divide continues
Key Insights
- In the last quarter of 2021, the PULSe indicator spiked in late November due to panic over the highly transmissible omicron variant but has abated since then.
- The Pandemic factor rose in December, rapidly trending toward the highest level since March 2020 as the omicron variant rapidly spread in all major countries.
- Sentiment and Liquidity oscillated between the crisis and stable zones, driven by the omicron variant, inflation concerns, Fed discussions, and China regulation.
PULSe is a composite indicator that is designed to monitor the state of global financial markets since the coronavirus crisis started. It stands for Pandemic, Uncertainty, Liquidity, and Sentiment—four factors that we believe encompass much of the market’s dynamics. High positive values of PULSe are typically a negative sign for market stability.1
The PULSe composite indicator reached another high in late November after the August spike, its highest since the initial phase of the pandemic in 2020. It has since been abating, ending the quarter unchanged. The coronavirus omicron variant, central bank policies, inflation fears, and Chinese economic policies dominated the market environment.
PULSe decreased in December thanks to improvements in the Uncertainty (U), the Liquidity (L), and the Sentiment (Se) factors. PULSe was characterized as stable as of the end of December 2021:
- The Pandemic factor spiked and was approaching the crisis zone as the omicron variant rapidly spread in all major countries that we follow. Positive test ratios continued to rise, indicating the spread of the virus might be broader than reported. Consumer activities were negatively affected as reflected in lower Google retail mobility data.
- The Uncertainty factor decreased as oil inventory destocked, copper prices rose, and long-term government bond yields surged.
- The Liquidity factor plummeted as the spreads of U.S. 3-month commercial paper, the euro, IG financials, and U.S. high yield all contracted.
- The Sentiment factor declined notably as implied volatilities abated, carry currencies outperformed safe currencies, and the gold/copper price ratio moved lower.
Visualizing the PULSe Indicator
(Fig. 1) Expressed as an average of the four component indicators
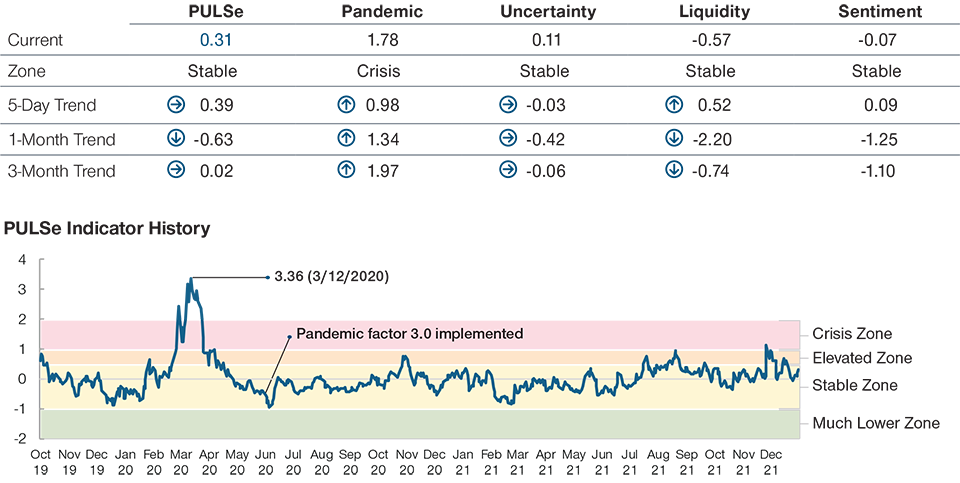
As of December 31, 2021.
Sources: Haver Analytics/Bloomberg Finance L.P. Analysis by T. Rowe Price.
For illustrative purposes only. Subject to change. The PULSe indicator has been developed by T. Rowe Price. Using different underlying indicators and data could yield different results. Future outcomes may differ significantly. Note that positive indicator values are typically a negative sign for market stability. The division of PULSe into zones is subjective, based on historical data and statistical assumptions. “Trends” represent the change in the given indicator over the stated period. Please see additional disclosures on the PULSe indicator at the end of this paper.
Radar Chart Showing the PULSe Indicator and Its Components
(Fig. 2) Radial axes expressed as z‑scores (number of standard deviations from the mean)

As of December 31, 2021.
Sources: Haver Analytics/Bloomberg Finance L.P. Analysis by T. Rowe Price.
For illustrative purposes only. Subject to change. The PULSe indicator was developed by T. Rowe Price. Using different underlying indicators and data could yield different results. Future outcomes may differ significantly. “5 days,” “1 month,” and “3 months” represent the z‑score readings at those time periods prior to the current period. Please see additional disclosures on the PULSe indicator at the end of this paper.
The Four Components of PULSe
(Fig. 3) Currently, only pandemic is elevated
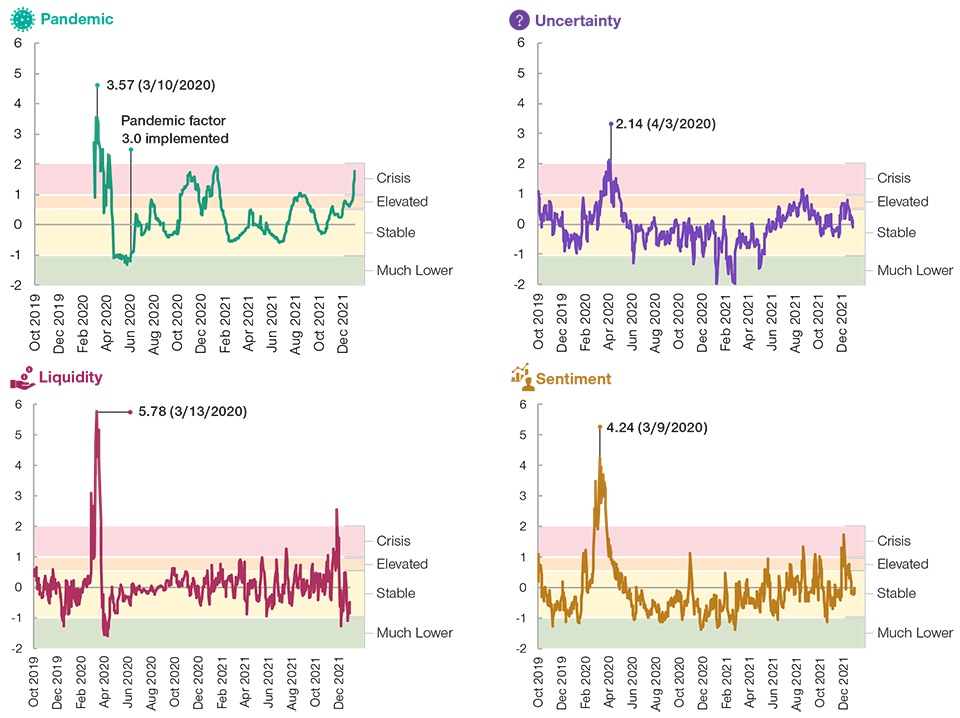
As of December 31, 2021.
Sources: Haver Analytics/Bloomberg Finance L.P. Analysis by T. Rowe Price. Indicator level on left‑hand side expressed as a z‑score, and the subjective stability zone is on the right‑hand side of each chart. For illustrative purposes only. Subject to change. The PULSe indicator was developed by T. Rowe Price. Using different underlying indicators and data could yield different results. Future outcomes may differ significantly. Note that positive indicator values are typically a negative sign for market stability. The division of PULSe into zones is subjective, based on historical data and statistical assumptions. Please see additional disclosures on the PULSe indicator at the end of this paper.
Background Note
In this note, we highlight two factors that contributed meaningfully to the PULSe indicator over the month of December:
1. The Omicron Variant Spread Rapidly in the U.S.
In the current Pandemic factor model, we look at three key metrics: (1) Daily new cases to track the spread of the coronavirus, (2) Positive testing ratios to confirm the trend of the diffusion curves, and (3) Google retail mobility data to assess the ongoing impact of the pandemic on consumer behavior.
In December, omicron outcompeted the delta variant and spread rapidly in the G-7 economies. Since the first U.S. case of the new variant was discovered in California at the beginning of December, omicron is already accounting for 95% of all daily cases now. As a leading indicator, the rising positive test ratio reflects potential underestimation of real infections and suggests further runway for this virus wave. Recently, Google retail mobility data started to decrease as local authorities put restrictions on social activities, which were likely to negatively affect services sectors during the holiday season.
The Omicron Variant Spread Rapidly in the U.S.
(Fig. 4) U.S. daily new cases and positive test ratio

As of December 31, 2021.
Sources: Haver Analytics/Bloomberg Finance L.P.
Various studies showed omicron is significantly more transmissible than delta. Reduced protection from the current mRNA vaccines added to the concerns, although studies by Pfizer supported the booster shot’s efficacy against omicron. On the bright side, earlier evidence from South Africa and the UK indicated that omicron leads to milder symptoms compared with previous coronavirus variants.
However, we have been seeing sharply rising hospitalizations in the U.S. recently. Note that hospitalizations tend to lag daily new cases by one to two weeks. As our colleague Berg Cui wrote, the answer is probably twofold. First, although hospitalizations as a percentage of total cases remain moderate, the absolute number of cases is growing very fast, and this results in higher absolute hospitalization numbers. Second, when the omicron wave hit, the U.S. was still going through the winter delta wave, which accounted for more than half of the current hospitalizations. It looked as though the U.S. was close to the limit of what the health care system could cope with.
Consumer Activities Were Negatively Affected
(Fig. 5) U.S. daily new cases and Google retail mobility

As of December 31, 2021.
Sources: Haver Analytics/Bloomberg Finance L.P.
Our medium-term view is that COVID-19 will be treated like seasonal flu once enough of the global population gets vaccinated and receives regular booster shots or antiviral drugs. This should allow the cyclical part of the economy to fully recover and benefit from the “excess spending reserves” for businesses and consumers. However, this view has been delayed by the emergence of new variants. We still believe that the COVID-off destination remains our base case, and it has only been delayed, not derailed.
2. Implied Volatilities Abated
This quarter has been marked by a roller coaster in implied equity market volatilities due to the coronavirus and the U.S. Federal Reserve’s “hawkish” pivot. Toward the end of the period, implied volatilities finally abated on positive developments. The implied volatility of a market index reflects investors’ forecast of a likely movement in security prices in that market, and is often thought to be a proxy for market risk.
When people in the U.S. were still in the mood of Thanksgiving celebration, the VIX index spiked 54% on Black Friday after scientists in South Africa first announced the discovery of the highly transmissible omicron variant of the coronavirus, reflecting a deterioration in investor sentiment due to increased uncertainty. Implied volatilities abated in the second week of the month as investors looked past concerns over the new variant after anecdotal evidence from South Africa suggested that omicron might be causing milder disease symptoms. Before Christmas, Pfizer announced their receipt of FDA approval for their “at home” pill with 4 million courses expected to be distributed by mid-January. This led to further abatement in equity implied volatilities.
The hawkish tone of Fed interest rate discussions also added to the sense of panic in early December, as Fed Chair Jerome Powell acknowledged that inflation isn’t going away as fast as anyone would like and a faster tapering is coming as a result. As expected, later in the final Fed meeting of 2021, officials doubled the pace of the taper plan, which is now likely to end QE in March 2022, bringing forward the schedule for interest rate hikes. Markets took comfort in the fact that the “hawkishness” did not exceed expectations as reflected in reduced implied volatilities.
A Drop in the Implied Volatilities Indicates Improving Market Sentiment
(Fig. 6) S&P 500, Euro STOXX 50, and Nikkei implied volatilities

As of December 31, 2021.
Source: Bloomberg Finance L.P.
The long-awaited signs of China policy easing helped investor sentiment in the second week of December. The People’s Bank of China announced that it would cut the reserve requirement ratio for banks by 0.5% effective December 15, releasing RMB 1.2 trillion in long-term liquidity into the economy. In addition, the statement from China’s annual Central Economic Work Conference on December 10 was all about stability, signaling that policies may become more pro-growth this year.
Despite lower implied volatilities, the situation remains fluid. We believe the three forces that put the past quarter on a roller-coaster ride will continue to drive market sentiment in the first quarter of 2022.
1 For full details, please see our white paper, Taking the Market’s PULSe in the Coronavirus Era, and additional information at the end of this paper.
Click to download Full Report (PDF).
IMPORTANT INFORMATION
This material is being furnished for general informational and/or marketing purposes only. The material does not constitute or undertake to give advice of any nature, including fiduciary investment advice, nor is it intended to serve as the primary basis for an investment decision. Prospective investors are recommended to seek independent legal, financial and tax advice before making any investment decision. T. Rowe Price group of companies including T. Rowe Price Associates, Inc. and/or its affiliates receive revenue from T. Rowe Price investment products and services. Past performance is not a reliable indicator of future performance. The value of an investment and any income from it can go down as well as up. Investors may get back less than the amount invested.
The material does not constitute a distribution, an offer, an invitation, a personal or general recommendation or solicitation to sell or buy any securities in any jurisdiction or to conduct any particular investment activity. The material has not been reviewed by any regulatory authority in any jurisdiction.
Information and opinions presented have been obtained or derived from sources believed to be reliable and current; however, we cannot guarantee the sources’ accuracy or completeness. There is no guarantee that any forecasts made will come to pass. The views contained herein are as of the date noted on the material and are subject to change without notice; these views may differ from those of other T. Rowe Price group companies and/or associates. Under no circumstances should the material, in whole or in part, be copied or redistributed without consent from T. Rowe Price.
The material is not intended for use by persons in jurisdictions which prohibit or restrict the distribution of the material and in certain countries the material is provided upon specific request. It is not intended for distribution to retail investors in any jurisdiction.
February 2022 / INVESTMENT INSIGHTS