
July 2022 / INVESTMENT INSIGHTS
Reports of the Death of EM Debt Are Exaggerated
Spreads are attractive compared with other asset classes
Key Insights
- In a torrid period in financial markets, EM debt has been hit harder than other asset classes as risk‑averse investors have fled the asset class.
- History shows that EM drawdowns have often led to strong recoveries. Moreover, further potential sovereign defaults appear to have been priced in, making additional losses unlikely.
- As such, we believe that EM debt spreads are very attractive by historical standards and represent a strong buying opportunity.
Emerging market (EM) bonds have been hit by their worst losses of the past decade amid deep market anxiety over looming rate hikes and the threat of global recession. The rolling 12‑month return of the JP Morgan EMBI Global Diversified, the benchmark index of dollar‑denominated EM sovereign bonds, was -21.2% at the end of June. Despite this, we believe that the asset class’s fundamentals remain strong—and that current spreads present a strong buying opportunity.
It has been a torrid year in financial markets. Rising inflation, stagnant growth, and the disruption caused by Russia’s invasion of Ukraine have piled pressure onto economies that had already been hit hard by the coronavirus pandemic. Stocks and bonds have tumbled in tandem, leaving investors with few places to shelter until the turbulence subsides. Emerging markets, traditionally viewed as a riskier asset, have taken a bigger hit than some other areas of fixed income.
Valuations Better Reflect Reality Than Other Markets
So why do we believe that now may be a good time to invest in EM hard currency sovereign debt? Well, experience tells us that sharp declines in EM debt have been a strong contrarian indicator for performance over the following 12 months. In other words, sharp losses have historically been followed by strong rebounds (Figure 1). Moreover, any EM sovereigns that are likely to suffer permanent capital impairment over the next 12 to 24 months have already been identified and priced in—put simply, we do not believe there are many overpriced EM sovereign bonds at present. If we are right, the current spread on EM debt looks very attractive relative to history.
Sharp EM Debt Losses Have Typically Been Followed by Rebounds
(Fig. 1) Sell‑offs have historically been a strong contrarian indicator
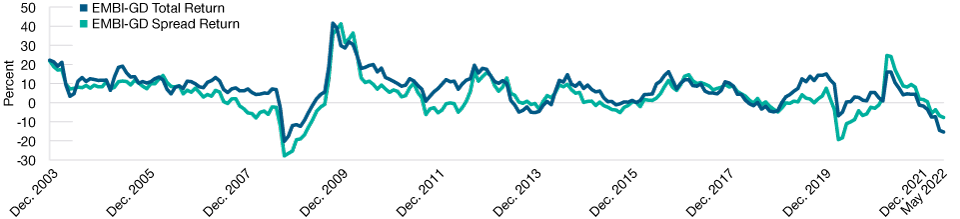
As of May 31, 2022.
Past performance is not a reliable indicator of future performance.
The spread/total return of the EMBI‑GD falling below zero has been a reliable indicator of double-digit returns over one year.
Source: JP Morgan (see Additional Disclosures).
Of the 20.2% decline in the EMBI Global Diversified, just over half (10.8%) derives from the rise in U.S. interest rates and the other half by worsening sentiment. Higher rates have meant that the yield available on EM debt is 2% to 3% higher than it was at the beginning of the year. So while rates are likely to remain elevated for some time to come (meaning any losses derived from rising U.S. rates will not be recovered in the near future), investors in EM debt are now getting a far better return than they were just six months ago.
Sentiment is more temporary and, therefore, more likely to change in the near‑to‑medium term. Despite improving fundamentals, EM debt remains a somewhat stigmatized asset class—investors typically regard it as more dispensable than, say, U.S. high yield, and are more likely to dump it when things get tough. At present, for example, the markets are pricing in a credit cycle in EM debt—around 35% of the option‑adjusted spread between EM debt and U.S. Treasuries derives from distressed bonds (Figure 2). By contrast, the U.S. high yield index spread contribution from distressed credit is close to a cyclical low.
Markets Are Pricing in an EM Debt Credit Cycle
(Fig. 2) Expected defaults are much higher than U.S. high yield
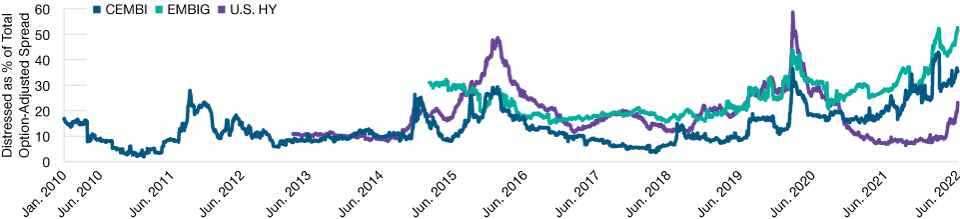
As of June 30, 2022.
Past performance is not a reliable indicator of future performance. Actual future outcomes may differ materially from expectations.
CEMBI: JP Morgan Corporate Emerging Market Bond Index, EMBIG: JP Morgan Emerging Market Bond Global Index, U.S. HY: US Corporate High Yield Bond Index.
Sources: JP Morgan and Bloomberg Finance L.P. Analysis by T. Rowe Price (see Additional Disclosures).
This does not necessarily imply that the markets are being overly negative about EM bonds; it does, however, suggest that there may be some lingering complacency toward other asset classes. While emerging markets have largely priced in the myriad risks to the global economy, it is possible that other markets have yet to fully absorb the bad news—or are benefiting from an assumption that central banks will cure all ills.
It is difficult to have a strong conviction on the likely short‑term direction of rates given the current level of uncertainty over the global economy and financial markets. Recent data have surprised, and the Fed has proved itself nimble in responding to data. Accordingly, the MOVE Index, which measures bond market volatility, is currently just below 140, up from around 85 in January (it was below 60 in June 2021), indicating a high level of uncertainty in the path of rates. However, while more surprises cannot be ruled out, it is likely that we are closer to the end than to the beginning of the Fed’s hiking cycle. We expect rate volatility to dampen before rates themselves come down, which should be a precursor for a recovery in EM bonds.
For investors concerned about duration, it’s worth emphasizing that break‑even rates are at cyclically high levels. Based on break-even rates, the 10‑year Treasury rates would need to rise by another 100bps before EM debt lost money over the coming year—possible, but highly unlikely.
Being Selective May Push Yields Higher
Overall, we believe that the current yield available on EM debt is a fair reflection of what an investor is likely to earn. Valuations seem broadly accurate, meaning that downside risk is likely to be contained. Moreover, opportunities exist for active investors to pursue yields above those of the JP Morgan EMBI Global Diversified by being selective. For example, investors may consider avoiding both distressed sovereigns and the highest‑quality names and choose, instead, to seek overweight positions on high‑quality B and BB rated names that offer yields above 7% and carry a very low risk of default. In addition, countries that either have nonaligned foreign policy or whose foreign policies are aligned with those of the west carry less tail risk than those potentially subject to sanctions or vulnerable to being dragged into regional disputes.
IMPORTANT INFORMATION
This material is being furnished for general informational and/or marketing purposes only. The material does not constitute or undertake to give advice of any nature, including fiduciary investment advice, nor is it intended to serve as the primary basis for an investment decision. Prospective investors are recommended to seek independent legal, financial and tax advice before making any investment decision. T. Rowe Price group of companies including T. Rowe Price Associates, Inc. and/or its affiliates receive revenue from T. Rowe Price investment products and services. Past performance is not a reliable indicator of future performance. The value of an investment and any income from it can go down as well as up. Investors may get back less than the amount invested.
The material does not constitute a distribution, an offer, an invitation, a personal or general recommendation or solicitation to sell or buy any securities in any jurisdiction or to conduct any particular investment activity. The material has not been reviewed by any regulatory authority in any jurisdiction.
Information and opinions presented have been obtained or derived from sources believed to be reliable and current; however, we cannot guarantee the sources’ accuracy or completeness. There is no guarantee that any forecasts made will come to pass. The views contained herein are as of the date noted on the material and are subject to change without notice; these views may differ from those of other T. Rowe Price group companies and/or associates. Under no circumstances should the material, in whole or in part, be copied or redistributed without consent from T. Rowe Price.
The material is not intended for use by persons in jurisdictions which prohibit or restrict the distribution of the material and in certain countries the material is provided upon specific request. It is not intended for distribution to retail investors in any jurisdiction.
July 2022 / MARKETS & ECONOMY