

Choose your location
Finland
English
Austria
Belgium
Denmark
Estonia
Finland
France
Iceland
Ireland
Italy
Latvia
Lithuania
Luxembourg
Netherlands
Norway
Portugal
Spain
Sweden
Switzerland
United Kingdom
 5 October 2026
Weekly Market Recap
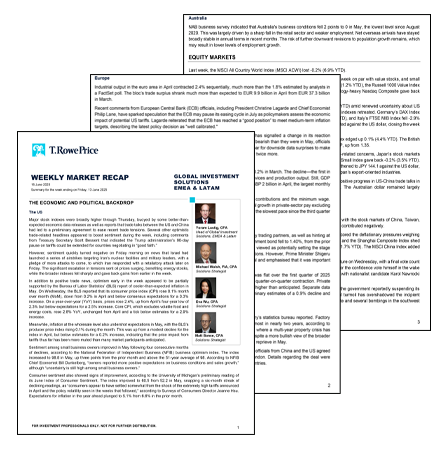
Our Global Investment Solutions team summarise the week's key market events and developments — with insights to support your client conversations and decision-making.
Key resources
Weekly Market article


Weekly Market data

Economic and political backdrop
The UK
Revised data showed that the UK economy expanded 0.5% in the second quarter, slightly stronger than the previous estimate of 0.4%, with services remaining the principal driver of growth. Still, elevated gilt yields continued to create a challenging backdrop for rate-sensitive sectors and kept attention on borrowing costs and the fiscal policy outlook. The S&P Global UK Manufacturing PMI rose to 51.9 in September. This was higher than the 51.7 registered in August.
The US
On Friday, the Bureau of Labor Statistics (BLS) reported that the US economy added 29,000 jobs in September, well below consensus expectations for around 90,000 and down from August’s downwardly revised gain of 133,000. July and August payrolls were revised down by a combined 60,000, with July now showing a loss of 10,000 jobs. The unemployment rate ticked up to 4.2% from 4.1%, and labour force participation was little changed at 61.8%. Stock futures advanced, and Treasury yields fell after the release Friday morning, while markets, as tracked by the CME FedWatch Tool, implied lower expectations for a rate hike at the Federal Reserve’s October meeting.
Earlier labour market data had offered mixed signals. Private payrolls firm ADP reported that private employers added 90,000 jobs in September, up from August’s revised reading of 36,000, while BLS data showed that job openings declined to 7.08 million in August from a revised 7.34 million in July. Meanwhile, initial jobless claims remained subdued at 197,000, little changed from the prior week, and continuing claims fell by 11,000 to 1.701 million. The Conference Board’s measure of consumers’ perceptions of labour market conditions also weakened to its lowest level in more than five years.
The Bureau of Economic Analysis (BEA) reported that its personal consumption expenditures (PCE) price index rose 0.3% in August and 3.4% over the prior 12 months. Core PCE inflation—which excludes food and energy—increased 0.2% for the month and 3.0% year over year (YoY). Both the headline and core PCE annual inflation figures were unchanged from July’s revised readings.
The BEA also revised second-quarter real gross domestic product (GDP) growth up to a 2.2% annualised rate from 1.5%, mainly reflecting higher investment, consumer spending, and government spending. Real final sales to private domestic purchasers—a measure of underlying private demand—increased at a 4.6% annualised rate, up from a previous estimate of 4.2%.
Manufacturing activity remained in expansion territory in September, according to the Institute for Supply Management. Its manufacturing Purchasing Managers’ Index (PMI) registered 54.5, little changed from August and marking a ninth consecutive month of expansion (readings above 50 indicate expanding activity). New orders and employment strengthened, but the prices index jumped 6.8 points to 77.9, its highest reading since May.
Europe
Oil and interest rates continued to strongly influence European equities. Brent crude moved above USD 108 per barrel early in the week as hopes for progress in US-Iran negotiations faded, reinforcing inflation concerns and pushing sovereign borrowing costs higher. Oil subsequently eased as crude flows through the Strait of Hormuz improved. Bond yields, however, remained elevated, suggesting that concerns about inflation, real rates, and fiscal sustainability extended beyond movements in energy prices alone.
September inflation readings generally surprised to the upside, reinforcing expectations that the European Central Bank may need to keep monetary policy restrictive. Annual inflation in the eurozone accelerated to 3.8% in September, up from 3.2% in August and above the 3.6% expected. Inflation accelerated to 3.3% in Germany, 3.0% in France, 4.9% in Spain, and 4.1% in Italy. Inflation data added to pressure on bond markets and rate-sensitive areas of the equity market.
France became an increasingly important source of country-specific risk. The government presented a 2027 budget aimed at reducing the fiscal deficit to 5% of GDP, but uncertainty over parliamentary approval renewed investor concerns about public finances. French borrowing costs rose sharply. The S&P Global France Manufacturing PMI slipped to 50.6 in September, down from 51.1 the previous month.
China
Chinese authorities rolled out a fresh raft of policy support to reverse a months-long moderation in economic momentum, after the State Council pledged to introduce “practical and effective additional policies.” Key measures included subsidies on mortgage interest payments for qualified first-time homebuyers. Beijing also unveiled steps to encourage banks to increase lending to targeted sectors. The People’s Bank of China cut the interest rate on its pledged supplementary lending (PSL) facility, which provides low-cost financing to selected policy banks to fund investment, while expanding the sectors eligible for PSL financing. The central bank also increased the quota for its relending programme supporting technological innovation upgrading.
Overall, the measures represent China’s biggest stimulus package since 2024 and could help ensure the achievement of the 4.5% to 5% economic growth target this year. However, some market participants felt that the measures may not be sufficient to address the economy’s structural imbalances of sluggish domestic demand and growing export reliance.
China’s official manufacturing PMI increased to 50.1 in September from 49.8 in August, returning to expansion for the first time in three months. Production accelerated at its fastest pace this year, helping to offset a modest moderation in the pace of new order growth. The improvement was also reflected in the private sector RatingDog manufacturing PMI, which climbed to a five-month high of 52.1 in September from 51.5 in August as output and new orders both rose.
Outside manufacturing, the official nonmanufacturing PMI rose to 50.2 in September from 49.0 in August. The services sector returned to growth, while construction activity expanded for the first time in 2026. Meanwhile, the RatingDog services PMI came in at 51.6 in September, up from 51.4 in August, driven by stronger new business inflows.
Japan
The Bank of Japan (BoJ)’s Summary of Opinions from its September monetary policy meeting, where the central bank raised its policy rate to its highest level since 1995, highlighted differing views over the pace of further tightening. One board member argued that the central bank may need to accelerate rate hikes if signs of an upward deviation in prices emerge, while another favoured bringing the policy rate closer to its approximate goal relatively soon. A more cautious view, however, was that underlying inflation was expected to reach 2% without accelerating at a pace that risked leaving the BoJ behind the curve, meaning there was no need to take hasty action. As the discussion tempered expectations for an immediate follow-up hike in October, the yield on the 10-year Japanese government bond remained elevated but ended the week broadly unchanged at 3.08%.
The yen traded around JPY 157 against the US dollar for much of the week. Finance Minister Satsuki Katayama reiterated that the currency’s undervaluation was problematic and said that Japan and the US would strengthen cooperation on foreign-exchange matters. Prime Minister Sanae Takaichi later said she had raised similar concerns with US President Donald Trump, while emphasising that stronger growth and competitiveness would help underpin confidence in the yen.
The BoJ’s September Tankan survey showed that sentiment among large manufacturers improved to +24 from +22 in June, although this was slightly below the +25 market consensus, while sentiment among large nonmanufacturers eased to +35 from +37. Separate data showed that Tokyo-area consumer inflation accelerated sharply in September, reinforcing expectations that the BoJ is likely to tighten policy further. The core consumer price index rose 2.7% YoY, up from 1.8% in August and above consensus, while inflation excluding fresh food and energy rose to 3.0% from 2.0%. Elsewhere, industrial production fell 1.7% month-over-month (MoM) in August, against expectations for an increase, highlighting some underlying weakness in activity.
Australia
The Reserve Bank of Australia (RBA) unanimously raised the cash rate by 25bps to 4.60% on Tuesday, a 15-year high. The Board statement maintained a hawkish tone, focusing on addressing upside inflation risks and leaving the door open to further hikes. Australia's headline CPI increased by 0.42% MoM in August, with YoY growth accelerating 52bps to 3.97%, broadly in line with expectations. The closely watched trimmed mean CPI rose 0.2% MoM and 3.6% YoY, matching the prior month. Household spending was flat in August, following three consecutive gains of near 1.0% MoM or higher. Annual growth eased to a still strong 6.8% YoY. Australia's goods trade balance narrowed by AUD 0.9 billion to AUD 0.5 billion in August, below expectations. Residential building approvals fell 6.1% MoM in August, below expectations. National house prices fell 1.1% MoM in September, extending the downturn to six consecutive months and leaving values 5.2% below their March peak.
Canada
The Bank of Canada is navigating a policy dilemma, with Deputy Governor Toni Gravelle acknowledging vigorous internal debate over how to balance trade war headwinds against rising inflationary pressures from elevated energy prices, while the central bank also eased short-term funding market strains. Statistics Canada's preliminary data showed GDP expanded just 0.2% in August following flat growth in July, signalling a marked third-quarter slowdown after a strong spring, though retail sales are estimated to have rebounded 1.3% in August.
Markets
Equity markets
Last week, the MSCI All Country World Index (MSCI ACWI) lost -0.7% (13.9% YTD).
The S&P 500 Index finished the week down -0.2% (13.8% YTD) as investors weighed a weaker-than-expected jobs report and declining expectations for a Fed rate hike against elevated Treasury yields, volatile oil prices, and ongoing uncertainty surrounding the US-Iran conflict. Treasury yields also remained a key focus, with long-term yields reaching multi-decade highs before retreating later in the week.
Large-cap growth stocks outperformed their value counterparts, while small caps finished ahead of large caps. The Russell 1000 Growth Index returned 0.7% (7.9% YTD), the Russell Value Index -1.0% (20.0% YTD), and the Russell 2000 Index of small companies -0.1% (15.3% YTD). The technology-heavy Nasdaq Composite gained 0.5% (17.5% YTD).
In Europe, the MSCI Europe ex-UK Index gave back -1.1% (8.6% YTD). European equities were volatile as elevated oil prices and rising sovereign bond yields appeared to weigh on investors' risk appetite. Stronger-than-expected inflation data reinforced concerns that monetary policy could remain restrictive. Among major stock indexes, Germany’s DAX Index declined -0.7% (3.0% YTD), France’s CAC 40 Index fell -2.1% (-0.3% YTD), and Italy’s FTSE MIB Index dropped -2.7% (15.8% YTD). Switzerland’s SMI lost -2.0% (6.1% YTD). The euro weakened against the US dollar, closing the week at USD 1.13 per EUR, down from 1.14.
The FTSE 100 Index in the UK fell -2.1% (8.1% YTD), while the FTSE 250 Index of smaller companies edged down -0.2% (10.4% YTD). The British pound was little changed against the US dollar for the week, closing at USD 1.32 per GBP.
Japan’s stock market returns were negative over the week. The TOPIX Index slid -0.1% (22.5% YTD), and the TOPIX Small Index declined by -0.9% (22.1% YTD). Gains were concentrated in artificial intelligence (AI)- and semiconductor-related shares, supported by strength in global chip stocks and renewed optimism around demand for AI infrastructure. Broader sentiment was more subdued amid elevated bond yields and expectations for further BoJ tightening, reinforced late in the week by a hotter-than-expected Tokyo-area inflation print.
In Australia, the ASX 200 Index added 0.2% (3.4% YTD) thanks to softer-than-expected inflation data. Australian government bond yields fell, and the curve steepened. The Australian dollar weakened 1.1% against the US dollar.
In Canada, the S&P/TSX Composite finished the week down -0.7% (13.9% YTD).
Emerging markets and other markets
The MSCI Emerging Markets Index lost -1.3% (23.8% YTD). Taiwan and Brazil contributed positively, while China, South Korea, and India contributed negatively.
China equities pulled back over the week, with mainland markets closed on Thursday and Friday for the Golden Week holiday. In the week through Wednesday, the CSI 300 Index, the main onshore benchmark, was down -1.8% (-4.1% YTD), while the Shanghai Composite Index declined -1.2% (-1.4% YTD). Information technology stocks led the decline. Domestic semiconductor names retreated on worries about intensifying competitive pressures and speculation that Beijing may allow companies to buy NVIDIA chips, while reports of potential US restrictions weighed on shares of optical equipment makers. Hong Kong's benchmark Hang Seng Index slumped -2.2% (-4.0% YTD), suffering heavy losses on Friday as the Hong Kong market reopened following Thursday’s closure. Financials and technology stocks were among the biggest laggards, hurt by rising US bond yields and disappointment over Beijing’s latest stimulus package. The MSCI China Index, which primarily comprises offshore-listed stocks, gave back -1.9% (-12.6% YTD).
In Brazil, Brazilian equities advanced over the week, although trading was volatile as investors positioned ahead of Sunday’s presidential election. The Ibovespa received support at different points from financial and oil-related shares, while the real fluctuated amid domestic political uncertainty and swings in the US dollar, global bond yields, and oil prices. Polling continued to point to a closely contested race between President Luiz Inácio Lula da Silva and Senator Flávio Bolsonaro, with a runoff remaining possible.
Domestic data presented a mixed backdrop for monetary policy. Brazil created a stronger-than-expected 165,827 formal jobs in August, led by services and construction, underscoring continued labour market resilience even as broader economic momentum moderated. At the same time, signs of financial strain persisted, with the delinquency rate on non-earmarked loans reaching a record 6.6% in August. Fiscal concerns also remained in focus after central bank data showed gross government debt rising to 82.9% of GDP, largely reflecting higher interest expenses. Taken together, resilient employment alongside elevated fiscal and credit pressures complicated the outlook for further central bank easing.
Fixed income markets
Last week, the Bloomberg Global Aggregate Index (hedged to USD) returned -0.2% (-1.3% YTD), the Bloomberg Global High Yield Index (hedged to USD) -0.9% (0.5% YTD), and the Bloomberg Emerging Markets Hard Currency Aggregate Index -1.2% (-2.3% YTD).
Over the week, the 10-year Treasury yield increased by 9bps to 5.27% from 5.16% (up 110bps YTD). The 2-year Treasury yield decreased by -2bps, ending the week at 4.83% from 4.85% (up 135bps YTD).
Over the week, the 10-year German Bund yield decreased by -14bp, ending at 3.46% from 3.60% (up 61bps YTD). The 10-year UK gilt yield was little changed, ending the week at 5.37% (up 89bps YTD).
Sign up to receive our weekly market recap every Monday at 9am BST
Our Weekly Market Recap is designed to keep you updated on the previous week's major events and developments. It includes:
- Concise summaries of key market events and trends
- Insights and analysis from our expert team
- Market perspectives to aid your client conversations
Global Investment Solutions Team
 Yoram Lustig, CFA, PRM™
Head, Global Investment Solutions, EMEA
Yoram Lustig, CFA, PRM™
Head, Global Investment Solutions, EMEA
Yoram Lustig is the head of Global Investment Solutions, EMEA, and a portfolio manager in the Multi-Asset Division. He also is the chair of the UK and European Investment Committees and a member of the Multi-Asset Steering Committee.
 Michael Walsh, CFA, CAIA®, FIA
Solutions Strategist
Michael Walsh, CFA, CAIA®, FIA
Solutions Strategist
Michael Walsh is a London-based solutions strategist on the Multi-Asset Solutions team for EMEA. He is a vice president of T. Rowe Price Group, Inc., and T. Rowe Price International Ltd.
 Eva Wu, CFA
Associate Solutions Strategist
Eva Wu, CFA
Associate Solutions Strategist
Eva Wu is an associate solutions strategist on the Multi-Asset Solutions team in the Multi-Asset Division. She is a vice president of T. Rowe Price International Ltd.
 Matt Bance, CFA
Solutions Strategist
Matt Bance, CFA
Solutions Strategist
Matt Bance is a solutions strategist and portfolio manager on the Multi-Asset Solutions team for the Europe, Middle East, and Africa region. He is a vice president of T. Rowe Price International Ltd.
202610 - 5986990
Notes
All data and index returns cited herein are the property of their respective owners, and provided to T. Rowe Price under license via data sources including Bloomberg Finance L.P., FactSet & RIMES, MSCI, FTSE and S&P. All rights reserved. T. Rowe Price seeks to cite data from sources it deems to be accurate, but it cannot guarantee the accuracy of any data cited herein. Neither T. Rowe Price, nor any of its third-party data vendors make any express or implied warranties or representations and shall have no liability whatsoever with respect to any data and index returns contained herein. The data and index returns cited herein may not be further redistributed or used as the basis for other indices, as a benchmark or as the basis for any other financial product.
The specific securities identified and described are for informational purposes only and do not represent recommendations.
CFA® and Chartered Financial Analyst® are registered trademarks owned by CFA Institute.
Important Information
The specific securities identified and described are for informational purposes only and do not represent recommendations.
This material is being furnished for general informational and/or marketing purposes only. The material does not constitute or undertake to give advice of any nature, including fiduciary investment advice, nor is it intended to serve as the primary basis for an investment decision. Prospective investors are recommended to seek independent legal, financial and tax advice before making any investment decision. T. Rowe Price group of companies including T. Rowe Price Associates, Inc. and/or its affiliates receive revenue from T. Rowe Price investment products and services. Past performance is not a guarantee or a reliable indicator of future results. The value of an investment and any income from it can go down as well as up. Investors may get back less than the amount invested.
The material does not constitute a distribution, an offer, an invitation, a personal or general recommendation or solicitation to sell or buy any securities in any jurisdiction or to conduct any particular investment activity. The material has not been reviewed by any regulatory authority in any jurisdiction.Information and opinions presented have been obtained or derived from sources believed to be reliable and current; however, we cannot guarantee the sources’ accuracy or completeness. There is no guarantee that any forecasts made will come to pass. The views contained herein are as of the date written and are subject to change without notice; these views may differ from those of other T. Rowe Price group companies and/or associates. Under no circumstances should the material, in whole or in part, be copied or redistributed without consent from T. Rowe Price.The material is not intended for use by persons in jurisdictions which prohibit or restrict the distribution of the material and in certain countries the material is provided upon specific request. It is not intended for distribution to retail investors in any jurisdiction.
Information and opinions presented have been obtained or derived from sources believed to be reliable and current; however, we cannot guarantee the sources’ accuracy or completeness. There is no guarantee that any forecasts made will come to pass. The views contained herein are as of the date written and are subject to change without notice; these views may differ from those of other T. Rowe Price group companies and/or associates. Under no circumstances should the material, in whole or in part, be copied or redistributed without consent from T. Rowe Price.
The material is not intended for use by persons in jurisdictions which prohibit or restrict the distribution of the material and in certain countries the material is provided upon specific request. It is not intended for distribution to retail investors in any jurisdiction.