December 2020 / INVESTMENT INSIGHTS
Investing in EM Corporate Bonds for Income and Diversification
An asset allocation perspective
Summary
In asset allocation, emerging market (EM) corporate bonds can be used to help investors achieve a range of objectives, in a range of market environments. In this discussion we focus on some of the characteristics EM corporates can bring to a portfolio, including:
- A large and expanding opportunity set
- A history of attractive returns with lower volatility than equities or high yield credit
- A history of relative resilience during market shocks
- A way to access emerging markets without direct exposure to EM currency risk
- Lower interest-rate sensitivity than that of developed-market government bonds
- A spectrum of credit profiles, with issuers ranging from risky high yield to strong investment grade
- Potential diversification benefits when combined with developed-market assets
In this discussion we use index data to compare asset classes but, in the diverse and under-researched EM corporate bond market, there are further potential benefits to be achieved with active management.
The unique characteristics of emerging market corporates
The EM corporate bond market has grown rapidly in recent years, and now consists of around 700 issuers from more than 50 countries.1 EM corporates can be used to fulfil several roles in a multi-asset portfolio, acting as a return-seeking asset that also offers some defensive properties.
EM corporates provide a significant yield uplift compared with developed-market (DM) investment grade (IG) credit and have a two-decade history of delivering attractive returns. Historically, these returns have come with lower volatility than high yield and equity markets, and an allocation to EM corporates would have brought portfolio diversification benefits, particularly when combined with developed-market government bonds.
As we’ll explore, EM corporates also exhibit relatively low duration (interest-rate sensitivity) compared with most other fixed income assets, and so can help to reduce overall exposure to DM interest-rate cycles.
We believe this unique combination of characteristics positions EM corporates to perform well in different market scenarios.
The risk-return trade off
As shown in Figure 1, since 2001, US$100 invested in EM corporate debt would have grown to about $374, compared with $466 in global high yield bonds and $500 in global equities. The upward path of EM corporates has been noticeably less volatile. The relatively high and steady coupons of EM corporate bonds have contributed to the strong historical returns of the asset class, as well as its relatively lower volatility.
Historically, EM corporate debt has been relatively resilient. For example, in the two months to the end of March 2020 during the Covid-19 shock, hard-currency EM corporates declined 11.5%, compared with losses of 19.8% for EM equities.1
Figure 1: 20-year performance of bonds and equities December 2001 to November 2020
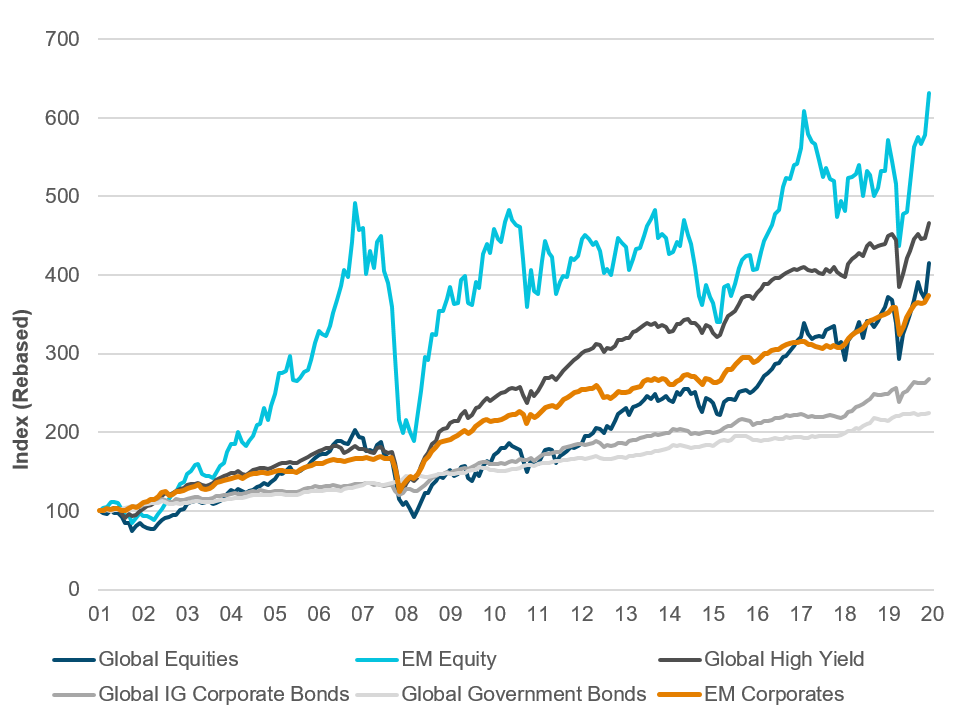
Past performance is not a reliable indicator of future performance.
All indices rebased to 100 on November 30, 2001.
Source: Bloomberg Barclays, MSCI. See Key to indices used and Additional Disclosures.
Figure 2: Asset class characteristics
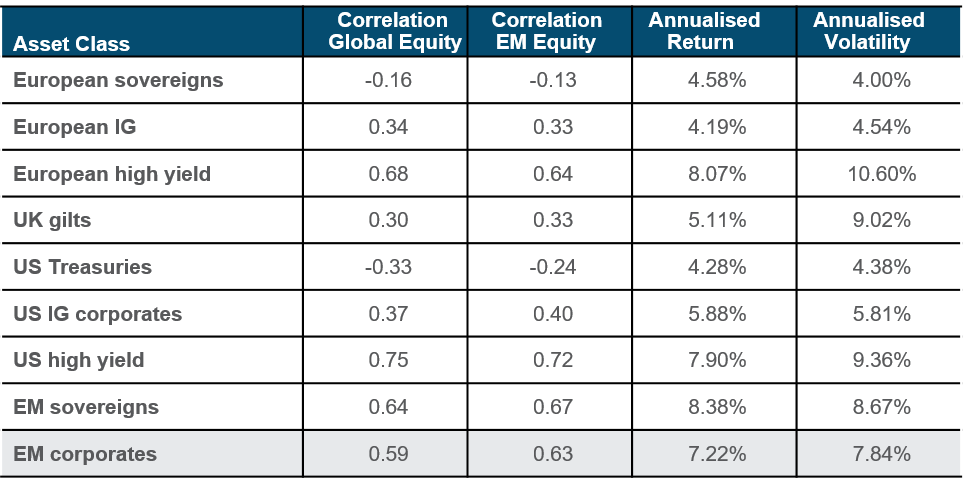
Past performance is not a reliable indicator of future performance.
For the period December 2001 to November 2020.
Source: Bloomberg Barclays, MSCI. See Key to Indices Used and Additional Disclosures
The long-term correlations of EM corporates with global and EM equities are significantly positive, at roughly 0.6 (Figure 2). EM corporates would not therefore hedge equity risk as effectively as high-quality, long-duration DM government bonds. But while these correlations are positive, they are imperfect, meaning that EM corporates bring some diversification benefits when combined with equities. Since 2001, EM corporates have been less volatile than global equities and, for the most part, global high-yield bonds (which exhibited lower volatility than EM corporates only during very calm market environments).That said, experience has shown that at times of market stress the correlation of EM corporates with stocks tends to rise.
Risk profile: currency, credit and interest rates
How well do emerging market corporates compensate investors for the three most common bond-market risks: interest rates (duration), credit and currency?
Currency risk: Hard-currency EM corporate bonds are denominated in US dollars and so carry no explicit currency risk for dollar-based portfolios. For non dollar-based portfolios, currency can be easily hedged (given the liquidity of the US dollar) to the investor’s base currency or left unhedged. As the dollar has historically acted as a safe-haven currency, dollar exposure could mitigate drawdowns in economic stress scenarios.
Interest-rate risk: Between December 2001 and November 2020, EM corporate bonds offered attractive annualized yields, roughly on par with European high yield bonds and EM hard currency sovereigns (Figure 3). The duration of the EM corporate bond index was significantly shorter than that of EM and developed market government bonds and those of DM investment-grade corporate bonds.2
One implication here is that EM corporates’ relatively short duration and high level of income should allow them to perform well in environments of modestly rising or falling rates. When rates rise, the attractive coupon could buffer some losses due to duration risk— for example at a yield level of 4%, interest rates would need to rise by about 0.84% for EM corporates to suffer capital losses. When rates fall, returns could come from both coupon and duration.
Credit risk: Looking at a commonly used EM corporate benchmark, the J.P Morgan CEMBI Broad Composite Index, the overall credit rating of the market is BBB-, in other words investment-grade quality. This contrasts with BB for the Bloomberg Barclays Global High Yield index. The profile of the EM corporate debt market has been improving over time. At the start of 2020, about 70% of EM corporate debt was investment grade, compared with less than 40% at the start of 2000. This improvement in credit quality has been driven by two main factors: fundamental improvements in EM countries and companies arising from growth and fiscal discipline, and change in the composition of the index since higher-quality Asian corporate debt has accounted for nearly all net new issuance since 2015.
Figure 3: Emerging market corporates offer attractive yield relative to interest-rate risk
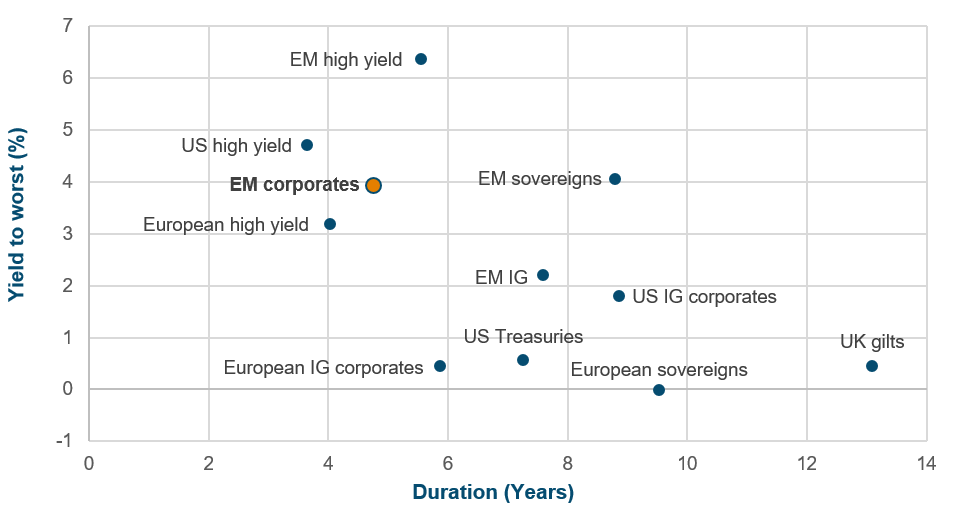
Past performance is not a reliable indicator of future performance.
For the period December 2001 to August 2020.
Source: Bloomberg Barclays. See Key to Indices Used and Additional Disclosures.
The relatively low representation of CCC rated credit and frontier market-issued bonds in the EM corporate indices means that the asset class has lower inherent ‘tail risk’ (low- probability, high-value losses) than EM hard- currency sovereigns and high yield bonds.
Diversification benefits: Combining EM corporates with a defensive asset
Thanks to their low correlation with global government bonds, adding some EM corporate bonds to a portfolio could — perhaps counterintuitively — mitigate risk. Figure 4 shows different mixes of global DM government bonds and EM corporate bonds, for the period December 2001 to November 2020. Allocating 10% to EM corporates and 90% to global DM government bonds would have reduced risk while increasing return. Allocating 20% to EM corporate bonds would have increased volatility only marginally.
Conclusion: The EM credit opportunity
EM corporate debt is a risk asset, correlated with global equities, and so investors should consider the potential for volatility and capital loss. Investors should also be aware of EM-specific risks such as political risk, and variation in standards of corporate governance and accounting practices that in some cases are still converging toward established conventions in developed markets. Nevertheless, active management and careful security selection can help manage risks, helping investors to reap the benefits of the asset class.
In a low yield environment, EM corporate bonds offer the potential for attractive returns because of their high yields, potential for capital appreciation and portfolio diversification benefits. There is also potential for alpha (excess returns over the index) from active management. This discussion has been limited to aggregate index data, but active security selection can enhance outcomes. The choice of EM corporate issuers spans a wide range of sectors, durations, credit qualities and underlying macro and micro economic dynamics, and the EM corporate market is less researched and efficient compared with its DM counterparts These features offer more opportunities for active management to add value over and above the performance of the index.
Figure 4: Impact of adding EM corporates to a DM bond portfolio
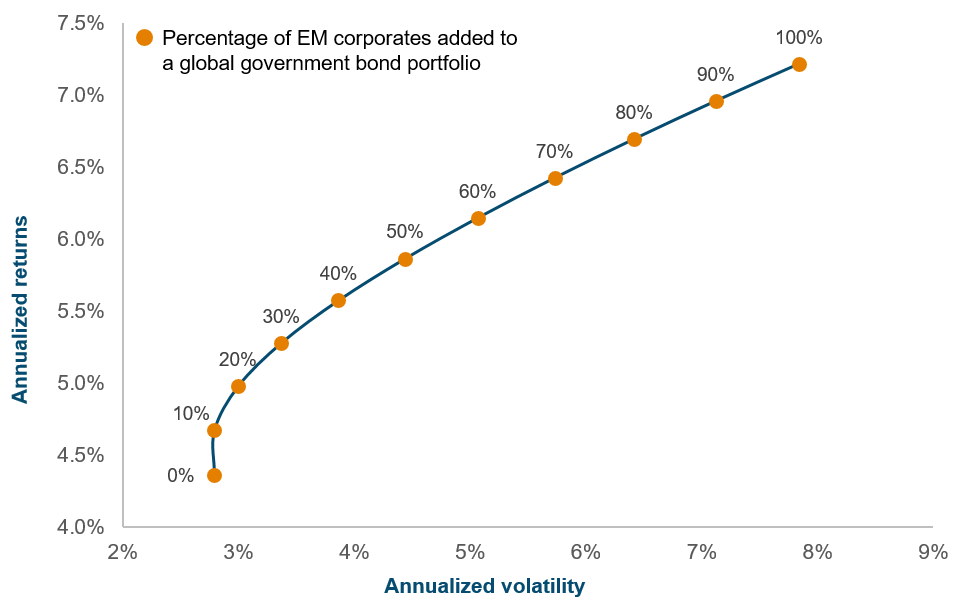
Past performance is not a reliable indicator of future performance.
For the period December 2001 to November 2020. Returns and volatilities are calculated using monthly returns, assuming monthly rebalancing to target weights. This is for illustrative purposes only and is not representative of an actual investment or strategy. Actual investment results may vary significantly. Source: Bloomberg Index Services Limited and J.P. Morgan Chase. See Key to Indices Used and Additional Disclosures.
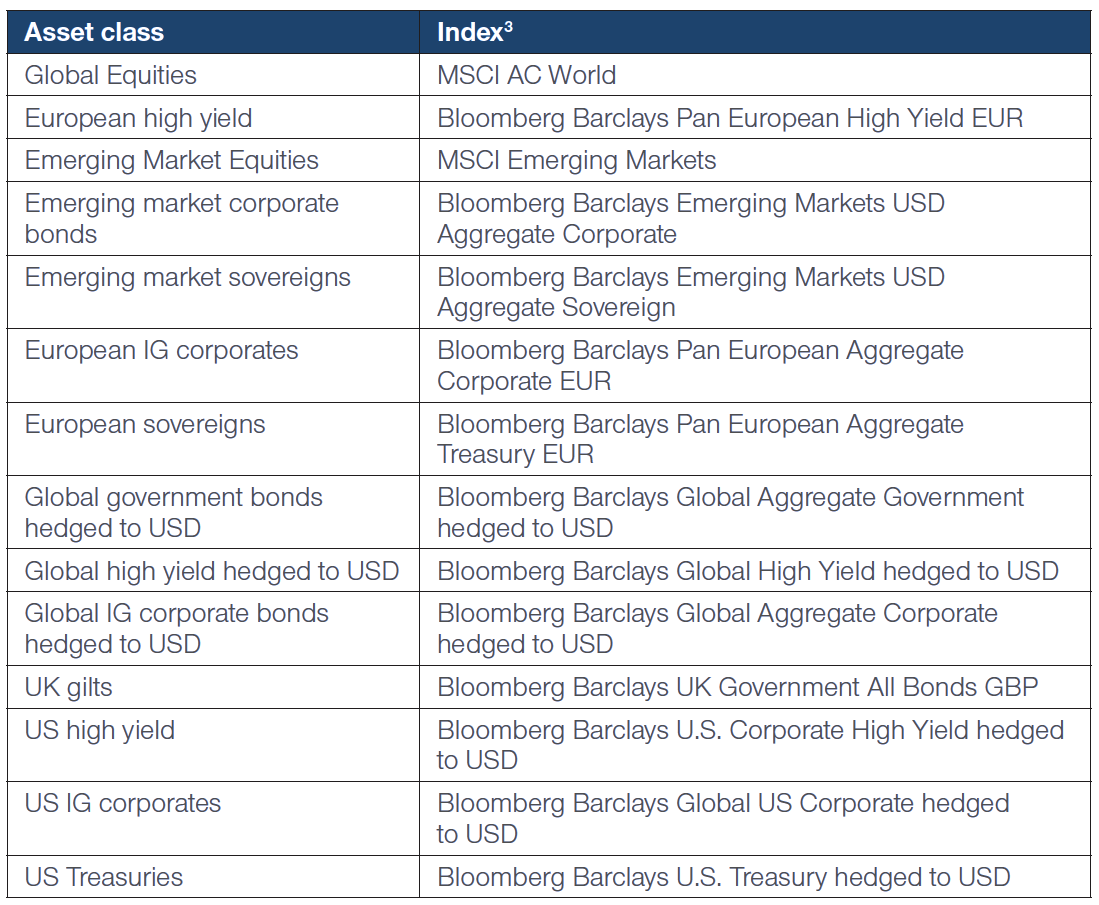
Key to Indices Used
IMPORTANT INFORMATION
This material is being furnished for general informational and/or marketing purposes only. The material does not constitute or undertake to give advice of any nature, including fiduciary investment advice, nor is it intended to serve as the primary basis for an investment decision. Prospective investors are recommended to seek independent legal, financial and tax advice before making any investment decision. T. Rowe Price group of companies including T. Rowe Price Associates, Inc. and/or its affiliates receive revenue from T. Rowe Price investment products and services. Past performance is not a reliable indicator of future performance. The value of an investment and any income from it can go down as well as up. Investors may get back less than the amount invested.
The material does not constitute a distribution, an offer, an invitation, a personal or general recommendation or solicitation to sell or buy any securities in any jurisdiction or to conduct any particular investment activity. The material has not been reviewed by any regulatory authority in any jurisdiction.
Information and opinions presented have been obtained or derived from sources believed to be reliable and current; however, we cannot guarantee the sources’ accuracy or completeness. There is no guarantee that any forecasts made will come to pass. The views contained herein are as of the date noted on the material and are subject to change without notice; these views may differ from those of other T. Rowe Price group companies and/or associates. Under no circumstances should the material, in whole or in part, be copied or redistributed without consent from T. Rowe Price.
The material is not intended for use by persons in jurisdictions which prohibit or restrict the distribution of the material and in certain countries the material is provided upon specific request. It is not intended for distribution to retail investors in any jurisdiction.
January 2021 / INVESTMENT INSIGHTS