
March 2021 / INVESTMENT INSIGHTS
Seeking Alpha in Emerging Markets Corporate Debt
After a decade of strong performance, the asset class deserves a serious look
Key Insights
- Emerging markets (EM) corporate debt is now a larger market than U.S. high yield or EM sovereigns, with over USD 2.5 trillion of bonds across 60 countries.
- Thanks to an average BBB‑ rating and generally healthy fundamentals, the asset class generated a 5.8% annualized return for the decade until December 31, 2020, with relatively modest drawdowns.1
- A benchmark‑agnostic but risk‑aware approach allowed the Emerging Markets Corporate Bond Strategy to outperform the index over one, three, and five years as of December 31 2020.2
Corporate debt is the fastest‑growing area of hard currency emerging markets (EM) debt, with almost USD 2.5 trillion outstanding and new issuance averaging 15% of debt outstanding per year since 2011. The asset class generated strong risk‑adjusted returns over the five years ended December 31, 2020, due to the broadly healthy balance sheets of most EM companies and a tilt toward investment‑grade (IG) Asian markets.
Going forward, we expect to see sustained opportunities in EM corporate debt as new issuers should continue to come to market and the asset class becomes more widely held among institutional investors. Additionally, we believe the asset class offers many opportunities for bottom‑up fundamental managers such as ourselves to potentially generate meaningful alpha for our clients.
Diverse Sources of Alpha
T. Rowe Price uses a benchmark‑agnostic but risk‑aware approach to select IG and high yield positions that we believe have the potential to outperform the broader market over the medium term. As we evaluate the approximately 1,300 companies in our investment universe, we focus on corporate governance; liquidity; detailed financial and strategic analysis; and environmental, social, and governance (ESG) considerations to help us identify outperformers and avoid credit distress.
(Fig. 1) Size of Global Bond Sectors
EM debt offers investors a large and diverse opportunity set.
Debt outstanding, as of December 31, 2020
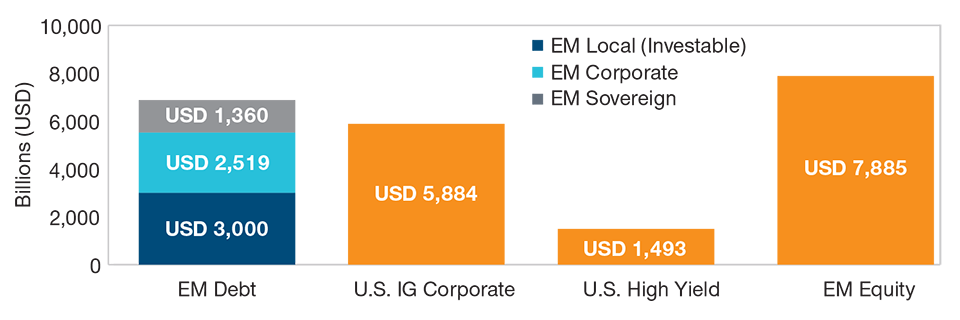
Sources: J.P. Morgan, Bloomberg Index Services Limited, and MSCI (see Additional Disclosures).
EM sovereign: J.P. Morgan Emerging Markets Bond Index Global, EM corporate: J.P. Morgan Corporate Emerging Market Bond Index Broad Diversified, EM local: J.P. Morgan Government Bond Index—EM Global Diversified, U.S. IG corporate: Bloomberg Barclays U.S. Corporate Investment Grade Index, U.S. high yield: Bloomberg Barclays U.S. High Yield Index, EM equity: MSCI Emerging Markets Index.
This systematic approach allowed us to outperform at the composite level both our benchmark and our eVestment peer universe over the three and five years ended December 31, 2020, by capturing diverse sources of genuine excess return rather than relying on carry or excessive portfolio concentration.
As of December 31, 2020, the EM corporate debt universe encompassed over 750 companies across 60 countries. Since 2011, the market has grown an average of 15% per year, fueled by numerous debt issuers, unlike the stable to shrinking U.S. high yield and EM sovereign debt markets.
(Fig. 2) Risk and Return Profiles
EM corporate bonds have featured relatively strong risk‑adjusted performance.
December 31, 2010, Through December 31, 2020

Past performance is not a reliable indicator of future performance.
Sources: J.P. Morgan, MSCI, Bloomberg Index Services Limited (see Additional Disclosures).
U.S. investment grade = Bloomberg Barclays U.S. Investment Grade Bond Index, EM sovereign = J.P. Morgan EMBI Global Diversified Index, EM corporate = J.P. Morgan CEMBI Broad Diversified, U.S. high yield = Bloomberg Barclays U.S. Corporate High Yield Index, Euro high yield = Bloomberg Barclays European High Yield Index Hedged, EM equities = MSCI Emerging Markets Index.
Higher credit quality, USD denomination, and a structural tilt toward Asia made EM corporate debt among the most defensive EM assets during recent market corrections. In 2018, for example, the J.P. Morgan CEMBI Broad Diversified declined 2% while most other EM assets declined 5%–15%.
In the first quarter of 2020, EM corporates3 experienced a monthly maximum drawdown of 11.5%, while other EM asset classes declined 13%–20%.
EM Corporates Offer Diversification Potential
While many institutional investors currently do not have strategic allocations to EM corporate debt, the asset class offers meaningful potential diversification benefits relative to many widely held institutional assets, particularly commodities, core fixed income, and U.S. equities.
(Fig. 3) EM Corporate Debt Ownership
Different buyer bases potentially allow managers to exploit regional inefficiencies.
Debt outstanding, as of July 31, 2019

Source: J.P. Morgan (see Additional Disclosures).
*Not including unidentified investors. Normalized to total 100%.
(Fig. 4) Contributions to Excess Returns for Emerging Markets Corporate Bond Representative Portfolio
Most sectors and half of EM countries contributed meaningfully to positive performance.*
Five Years ended December 31, 2020

Past performance is not a reliable indicator of future performance.
The representative portfolio is an account in the composite we believe most closely reflects current portfolio management style for the strategy. Performance is not a
consideration in the selection of the representative portfolio. The characteristics of the representative portfolio shown may differ from those of other accounts in the
strategy. Please see the GIPS® Composite Report for additional information on the composite. Sector classifications based on T. Rowe Price internal classifications.
Source: T. Rowe Price.
*Versus the J.P. Morgan CEMBI Broad Diversified.
In addition to generating attractive risk‑adjusted returns at the index level, a closer examination of the EM corporate debt universe shows that different regions historically have offered significantly different risk/return profiles, allowing investors to calibrate their exposures throughout a market cycle.
Very different domestic buyer bases also potentially allow active managers to exploit technical inefficiencies across regions. In Asia, large numbers of local buyers historically have tended to provide support during market sell-offs, generating a more defensive return profile. In Latin America, by contrast, foreign investors—including U.S. crossover investors—dominate the market, making for more frequent technical dislocations.
Global Research and Trading Capabilities
To exploit this opportunity set, T. Rowe Price has built truly global research and trading platforms. We believe our commitment to on‑the‑ground research and value‑added trading gives us the ability to identify and thoroughly evaluate ideas across regions as the opportunity set shifts.
In our view, it is difficult, if not impossible, to fully assess an EM corporate bond issue without understanding the home country’s politics, economics, and equity markets. Therefore, prior to the coronavirus pandemic, members of our teams were taking nearly 200 research trips a year to gain local knowledge that can create a competitive edge—a pace they hope to resume as soon as conditions normalize.
In addition, T. Rowe Price’s trading resources help us identify potential price dislocations while helping ensure that we are adequately compensated for providing liquidity to the market and can execute trades during local market hours across the globe. Although our security selection process primarily is based on company fundamentals, our quantitative analysis team and our enterprise risk team both help us evaluate and hedge systematic risk.
A Disciplined, Risk‑Aware Investment Process
To achieve their objectives, our EM corporate bond professionals employ a five‑step
investment process.
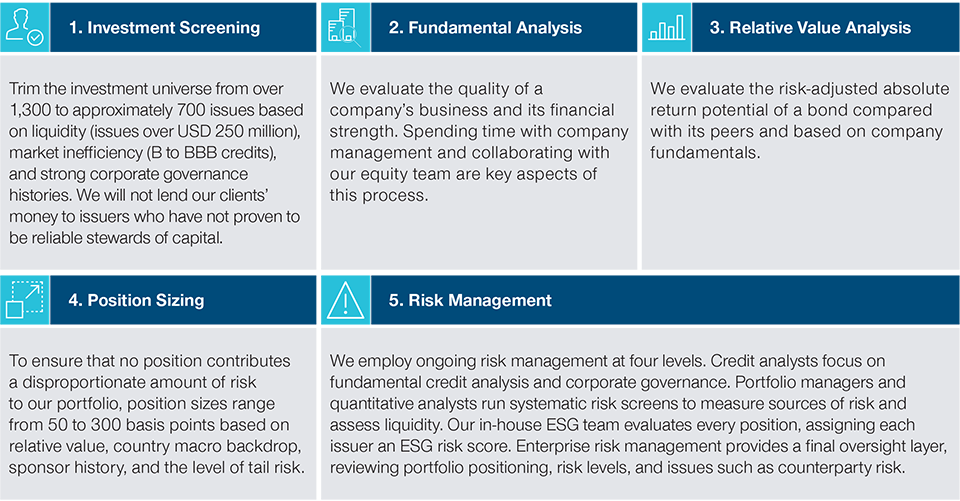
Our investment process is designed with two goals in mind:
- to identify diverse and repeatable sources of alpha, and
- to avoid permanent capital impairment due to default.
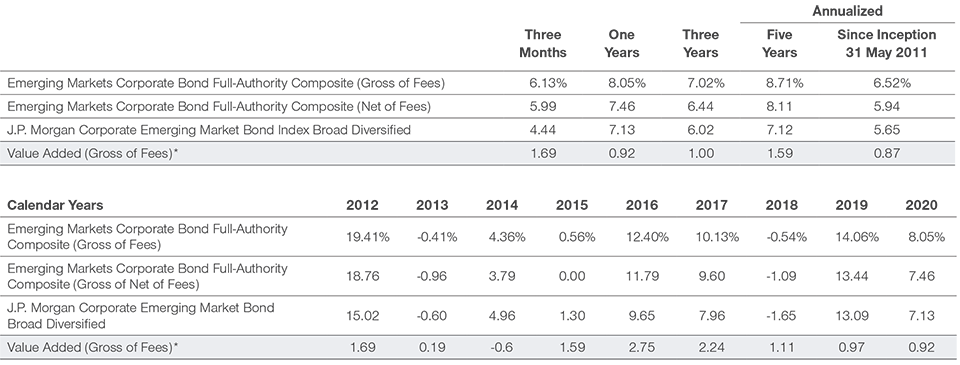
(Fig. 5) Performance
The Emerging Markets Corporate Bond Full-Authority Composite outperformed its benchmark.
Five Years Ended December 31, 2020, in USD, Gross of Fees

Past performance is not a reliable indicator of future performance.
Source: T. Rowe Price, and J.P. Morgan Chase (see Additional Disclosures).
Gross performance returns are presented before management and all other fees, where applicable, but after trading expenses. Gross performance returns reflect the reinvestment of dividends and are net of all nonreclaimable withholding taxes on dividends, interest income, and capital gains.
Past performance is not a reliable indicator of future performance.
Gross performance returns are presented before management and all other fees, where applicable, but after trading expenses. Net of fees performance reflects the deduction of the highest applicable management fee that would be charged based on the fee schedule contained within this material, without the benefit of breakpoints. Gross and net performance returns reflect the reinvestment of dividends and are net of all non-reclaimable withholding taxes on dividends, interest income, and capital gains.
*The Value Added row is shown as Emerging Markets Corporate Bond Full-Authority Composite (Gross of Fees) minus the benchmark in the previous row.
Source: T. Rowe Price.
(Fig. 6) Upside/Downside Capture vs. Peer Group
The strategy seeks to overweight high yield in up markets while avoiding weaker credits in drawdowns.
December 31, 2015, through December 31, 2020

Past performance is not a reliable indicator of future performance.
Source: eVestment Alliance, LLC. eVestment peer universe = EM corporate bond managers excluding high yield-only, investment‑grade‑only, and short‑duration‑only strategies. Returns are gross of fees.
*eVestment data for the fourth quarter of 2020.
Positive Five‑Year Performance Results
Over time, our investment process enabled the Emerging Markets Corporate Bond Strategy at the composite level to generate a positive return stream, with only a few periods of notable underperformance as of December 31, 2020. We have achieved these results primarily through principal appreciation and by avoiding defaults, rather than simply out‑carrying the benchmark.
Decomposing attribution by sector and country sheds some light on how returns were generated. Consistent with our approach, there were no outsized detractors while most sectors and half of countries contributed meaningful amounts of excess return over the five years ended December 31, 2020, with most of these positions adding 20–100 basis points, gross of fees, over that period.
Up/down market capture results reflect a similar pattern. Over the five years ended December 31, 2020, the strategy outperformed at the composite level by a large margin during up markets by selectively overweighting high yield credits while avoiding the weakest parts of the market during drawdowns.
WHAT WE’RE WATCHING NEXT
In our view, the past few years have demonstrated that EM corporate debt is an underowned asset class that offers potentially attractive risk‑adjusted returns at the index level as well as many potential opportunities for outperformance through security selection.
Over time, we expect that the asset class will become more widely embraced by institutional investors as the U.S. high yield market shrinks and the size and depth of the EM corporate opportunity set become better understood.
GIPS® Composite Report
Emerging Markets Corporate Bond Full-Authority Composite
Period ended December 31, 2020. Figures are shown in U.S. dollars
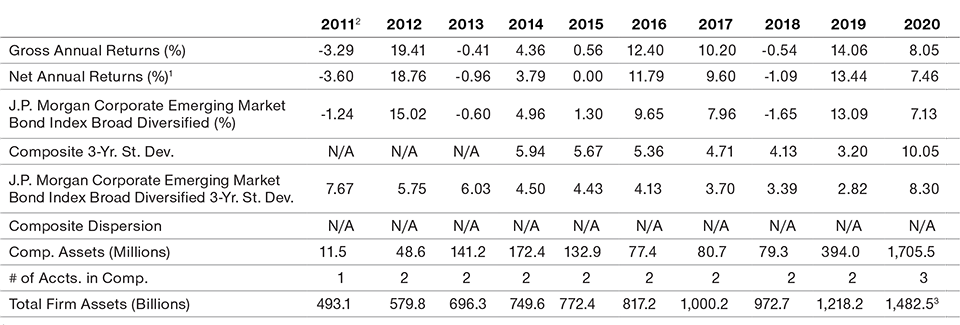
1Reflects deduction of highest applicable fee schedule without benefit of breakpoints. Investment return and principal value will vary. Past performance cannot guarantee future results. Monthly composite performance is available upon request. See below for further information related to net of fee calculations.
2May 31, 2011, through December 31, 2011.
3Preliminary—subject to adjustment.
T. Rowe Price (TRP) claims compliance with the Global Investment Performance Standards (GIPS®) and has prepared and presented this report in compliance with the GIPS standards. TRP has been independently verified for the 24-year period ended June 30, 2020 by KPMG LLP. The verification report is available upon request. A firm that claims compliance with the GIPS standards must establish policies and procedures for complying with all the applicable requirements of the GIPS standards. Verification provides assurance on whether the firm’s policies and procedures related to composite and pooled fund maintenance, as well as the calculation, presentation, and distribution of performance, have been designed in compliance with the GIPS standards and have been implemented on a firm wide basis. Verification does not ensure the accuracy of any specific composite presentation. TRP is a U.S. investment management firm with various investment advisers registered with the U.S. Securities and Exchange Commission, the U.K. Financial Conduct Authority, and other regulatory bodies in various countries and holds itself out as such to potential clients for GIPS purposes. TRP further defines itself under GIPS as a discretionary investment manager providing services primarily to institutional clients with regard to various mandates, which include U.S., international, and global strategies but excluding the services of the Private Asset Management group. The minimum asset level for equity portfolios to be included in composites is $5 million and prior to January 2002 the minimum was $1 million. The minimum asset level for fixed income and asset allocation portfolios to be included in composites is $10 million; prior to October 2004 the minimum was $5 million; and prior to January 2002 the minimum was $1 million. Valuations are computed and performance reported in U.S. dollars.
Gross performance returns are presented before management and all other fees, where applicable, but after trading expenses. Net of fees performance reflects the deduction of the highest applicable management fee that would be charged based on the fee schedule contained within this material, without the benefit of breakpoints. Gross and net performance returns reflect the reinvestment of dividends and are net of nonreclaimable withholding taxes on dividends, interest income, and capital gains. Effective June 30, 2013, portfolio valuation and assets under management are calculated based on the closing price of the security in its respective market. Previously portfolios holding international securities may have been adjusted for after-market events. Policies for valuing portfolios, calculating performance, and preparing compliant presentations are available upon request. Dispersion is measured by the standard deviation across asset-weighted portfolio returns represented within a composite for the full year. Dispersion is not calculated for the composites in which there are five or fewer portfolios.
Some portfolios may trade futures, options, and other potentially high-risk derivatives which generally represent less than 10% of a portfolio.
Benchmarks are taken from published sources and may have different calculation methodologies, pricing times, and foreign exchange sources from the composite.
Composite policy requires the temporary removal of any portfolio incurring a client initiated significant cash inflow or outflow greater than or equal to 15% of portfolio assets. The temporary removal of such an account occurs at the beginning of the measurement period in which the significant cash flow occurs and the account re-enters the composite on the last day of the current month after the cash flow. Additional information regarding the treatment of significant cash flows is available upon request.
The firm’s list of composite descriptions, a list of limited distribution pooled fund descriptions, and a list of broad distribution pooled funds are available upon request. GIPS® is a registered trademark of CFA Institute. CFA institute does not endorse or promote this organization, nor does it warrant the accuracy or quality of the content contained herein.
A portfolio management change occurred effective June 30, 2020. There were no changes to the investment program or strategy related to this composite.
Fee Schedule
Emerging Markets Corporate Bond Full-Authority Composite.
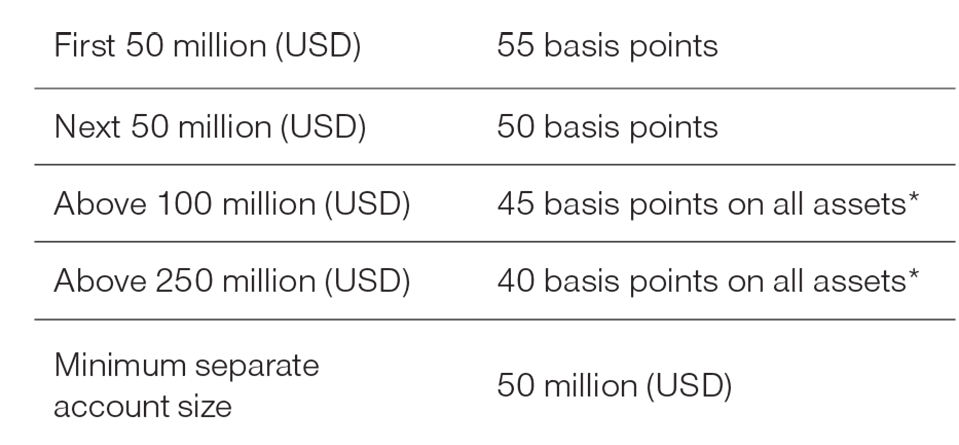
As of December 31, 2020. The Emerging Markets Corporate Bond Composite Full-Authorityis comprised of portfolios seeking current income and capital appreciation primarily throughinvestment in a broader universe of fixed income corporate debt securities and quasi-sovereigndebt securities issued by companies located or having a business activity in emerging/developingcountries. While largely focused on dollar-denominated corporate bonds, the composite hasthe ability to invest in local currency corporates as well as dollar-denominated sovereigns. TheFull-Authority composite maintains broader discretion seeking to invest in the entire emergingmarkets corporate universe. (Created December 2017; incepted 31 May 2011) (Formerly known asEmerging Markets Corporate Bond Composite)*A transitional credit is applied to the fee schedule as assets approach or fall below the breakpoint.
IMPORTANT INFORMATION
This material is being furnished for general informational and/or marketing purposes only. The material does not constitute or undertake to give advice of any nature, including fiduciary investment advice, nor is it intended to serve as the primary basis for an investment decision. Prospective investors are recommended to seek independent legal, financial and tax advice before making any investment decision. T. Rowe Price group of companies including T. Rowe Price Associates, Inc. and/or its affiliates receive revenue from T. Rowe Price investment products and services. Past performance is not a reliable indicator of future performance. The value of an investment and any income from it can go down as well as up. Investors may get back less than the amount invested.
The material does not constitute a distribution, an offer, an invitation, a personal or general recommendation or solicitation to sell or buy any securities in any jurisdiction or to conduct any particular investment activity. The material has not been reviewed by any regulatory authority in any jurisdiction.
Information and opinions presented have been obtained or derived from sources believed to be reliable and current; however, we cannot guarantee the sources’ accuracy or completeness. There is no guarantee that any forecasts made will come to pass. The views contained herein are as of the date noted on the material and are subject to change without notice; these views may differ from those of other T. Rowe Price group companies and/or associates. Under no circumstances should the material, in whole or in part, be copied or redistributed without consent from T. Rowe Price.
The material is not intended for use by persons in jurisdictions which prohibit or restrict the distribution of the material and in certain countries the material is provided upon specific request. It is not intended for distribution to retail investors in any jurisdiction.
March 2021 / INVESTMENT INSIGHTS
March 2021 / INVESTMENT INSIGHTS
