
September 2023 / ASSET ALLOCATION
Asset Allocation in a New and Evolving Interest Rate Regime
Revised capital market assumptions create opportunities
Key Insights
- The period of low yields following the global financial crisis forced many public defined benefit plans to allocate to riskier asset classes.
- Higher interest rates and capital market return assumptions provide an opportunity to revisit sources of return and risk at the asset class and strategy levels.
- Sponsors may want to reevaluate the multiple roles that different segments of the fixed income universe can now play in their portfolios to make them more efficient.
Following the 2008–2009 global financial crisis (GFC), investors grappled with over a decade of 0% interest rate policies and the implications of ultralow rates for their portfolios across both traditional and alternative asset classes. However, in a short period of time, that economic backdrop has reversed course amid an accelerated repricing of rates and inflation expectations, and a reversal of easy monetary policy by the U.S. Federal Reserve and other major central banks.
While the impact of this shift unfolds, many U.S. public defined benefit (DB) plans are now studying the implications of the current environment for their allocations, which looks very different from those that followed the GFC.
- For the first time since 2008, a number of asset classes, particularly non‑core bonds, such as high yield, bank loans, and emerging market (EM) debt, have the potential to generate returns that are close to or above the expected return‑on‑asset assumptions of many plans.
- With real yields on core investment‑grade bonds now meaningfully positive, the cost of diversification has declined. However, the correlation of stocks and bonds may be less certain.
In our view, increasing portfolio exposure to non‑core bonds appears to be a particularly attractive option for plans seeking additional sources of return generation. Lengthening duration within fixed income also could help offset the lower exposures that may have resulted from the asset allocation changes since the GFC. And, given the limitations of long duration as a diversifier when stocks and bonds sell off together, we think plans may want to consider adding other sources of diversification to their portfolios.
The Evolution of Public DB Asset Allocation
(Fig. 1) Average asset allocation of U.S. state and local pension plans
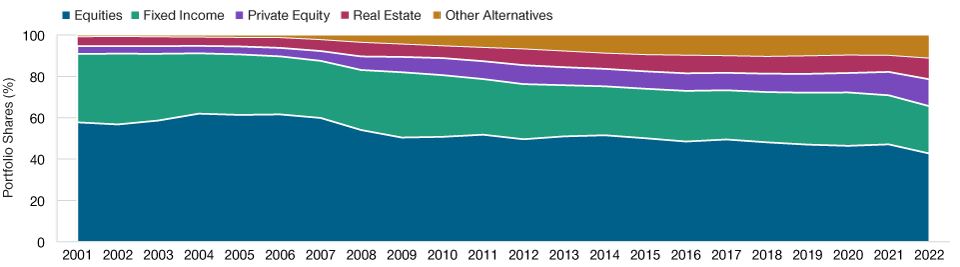
As of December 31, 2022.
Sources: Center for Retirement Research at Boston College, MissionSquare Research Institute, National Association of State Retirement Administrators, and theGovernment Finance Officers Association. Allocations sourced from public plans data, 2001–2022.
Where We Are, and How We Got Here
While each U.S. DB plan is unique, the low or near 0% interest rates that followed the GFC accelerated a structural allocation shift toward assets that offered higher expected returns (Figure 1). This shift to greater risk‑taking was notable in several ways:
- On average, public DB plans increased their allocations to private market assets, particularly private equity.
- Average allocations to public fixed income assets dropped significantly (from 30% to 20%, on an asset‑weighted basis). Allocations to private credit (with underlying floating rate loans) increased and likely reduced duration further unless duration was extended elsewhere in the portfolio.
- Many public DB plans also reduced their allocations to public equity. However, overall equity factor exposure has increased if we adjust for the higher equity beta for private equity and also include the equity beta often present in some other alternatives. Indeed, we estimate the average public DB plan’s equity exposure is actually about 10% higher than the reported notional exposures to public and private equity allocations (Figure 2).
Following the GFC, easy monetary policy combined with a less volatile business cycle provided tailwinds for both fixed income and equity assets—typically boosting the overall performance of diversified portfolios regardless of the specific allocation mix. And, with a few exceptions, high‑quality bonds typically provided effective diversification benefits when equities sold off meaningfully.
Where Do We Go From Here?
While there is plenty of room to debate when, and at what levels, interest rates will normalize, we believe 2022 marked the end of the long secular decline in rates that began in the early 1980s after the Federal Reserve, under former Chairman Paul Volcker, had raised U.S. rates to historically extreme levels to fight inflation.
For the first time in over 20 years, we believe public DB plans seeking to enhance portfolio returns now have options other than increasing their exposure to equity and liquidity risk.
Beware of “Hidden” Equity Beta
(Fig. 2) Equity allocation based on notional and estimated equity factor betas*
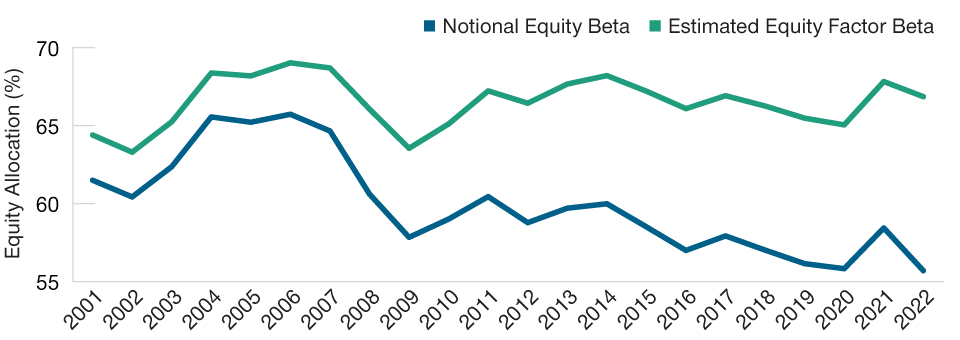
As of December 31, 2022
*Notional equity beta is the allocation to public and private equity without adjustment. Estimatedequity factor beta makes an adjustment to private‑equity allocations using an estimatedbeta of 1.2 and includes allocations to real estate, hedge funds, and other alternative assetcategories adjusted by an equity factor of 0.4. The estimated betas do not represent a specificimplementation and/or actual results and are not indicative of future results.
Sources: Center for Retirement Research at Boston College, MissionSquare Research Institute, NationalAssociation of State Retirement Administrators, and the Government Finance Officers Association.Allocations sourced from public plans data, 2001–2022.
Higher risk‑free rates have led many investment managers, including T. Rowe Price’s multi‑asset team, to raise their long‑term capital market assumptions (Figure 3). Specifically, our 10‑year annualized return expectation for core investment‑grade bonds is now at about 5%, while we expect returns on riskier, non‑core bonds (high yield, bank loans, EM debt) to range from 7% to more than 8%. This means that public plans may be able to seek the same or higher returns at similar or lower levels of expected risk, rather than continuing the post‑GFC trend of taking on more risk to offset the impact of lower expected returns.
Below are three notable steps that T. Rowe Price has taken in our own multi‑asset portfolios that we believe warrant consideration for U.S. public DB plans.
Capital Market Assumptions Have Increased
(Fig. 3) T. Rowe Price 10‑year capital market assumptions (CMAs)
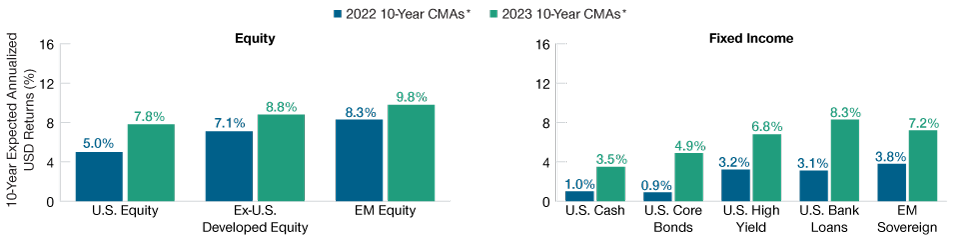
T. Rowe Price 10‑year capital market assumption methodology is consistent with the 5‑year methodology with an extended horizon for valuation convergence.
*Source: T. Rowe Price. This information is not intended to be investment advice or a recommendation to take any particular investment action. Forecasts arebased on subjective estimates about market environments that may never occur. See the Appendix for our capital market assumption modeling methodology, arepresentative list of indexes, and Important Information.
1. Increasing Allocations to Non‑core Bonds
In our view, higher‑yielding fixed income, including high yield bonds, bank loans, and EM debt, can now play a larger role in generating returns. As of mid‑2023, current yields in many non‑core sectors were higher than the median expected return on assets (EROA) for U.S. public DB plans. Even adjusted for defaults and recovery rate expectations, we believe returns are likely to be attractive.
It is true that non‑core bonds can be highly correlated with equities in extreme risk‑on and extreme risk‑off environments. However, they offer other meaningful diversification benefits that potentially make them strong complements to equities as sources of growth.
- Income is the primary, long‑term source of expected return, rather than capital appreciation as is the case with equities.
- Bonds sit higher in the capital structure, offering an additional measure of potential protection in a financial crisis in exchange in for sacrificing the upside of equities.
- We believe non‑core bonds will likely outperform in range‑bound equity markets, due to the relatively low dividend yields offered by most equities.
We believe U.S. plan sponsors may want to consider a total portfolio approach when funding non‑core bond allocations. This is particularly the case for plans that have lowered their core fixed income allocations to levels that make them impractical to use as a funding source. We believe a total portfolio solution that funds higher non‑core bond allocations from a mix of both public equities and core bonds can provide more flexibility while maintaining the current level of risk but still capturing the potential diversification benefits outlined above (Figure 4).
Options for Funding Non‑core Bonds
(Fig. 4) Asset class and total portfolio funding approaches
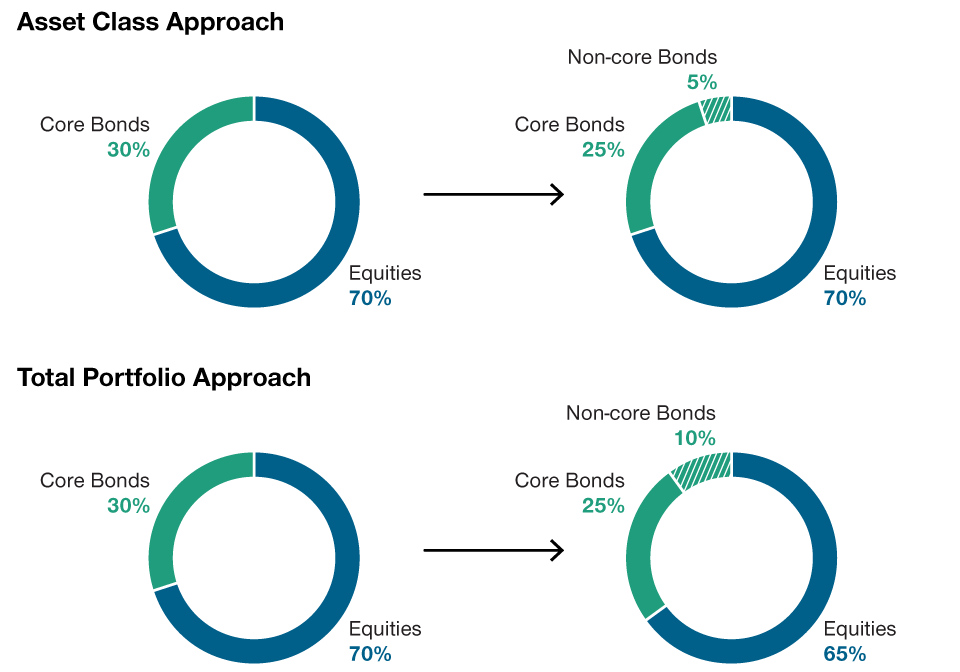
For illustrative purposes only. This is not intended to be investment advice or a recommendation totake any particular investment action. An individual plan’s situation will vary.
Source: T. Rowe Price.
Funding higher non‑core bond allocations entirely from existing core allocations could be expected to increase portfolio risk. While a shift toward non‑core bonds also would tend to enhance fixed income return potential, some plan sponsors might deem this increase unnecessary for meeting their return targets.
2. Adding Other Sources of Diversification
While core fixed income assets largely failed to mitigate equity risk when correlations spiked during the 2022 market sell‑off, we believe they still have a valuable role to play in mitigating downside risk. We expect this to be the case once the risk of persistent inflation subsides, giving policymakers room to cut rates in the face of a slowing economy. Unlike much of the past 15 years, the opportunity cost of this risk mitigation is meaningfully lower, in our view, as bonds now provide positive real yields.
That said, inflation risk remains persistent, and we believe plans may want to consider complementing core bonds with other strategies seeking to mitigate risk in market environments like the one seen in 2022. These could include:
- Less directional and more flexible bond strategies that seek absolute returns across the full global opportunity set.
- Equity strategies that aim to reduce volatility and drawdowns by incorporating a mix of low‑volatility equities and a dynamic volatility overlay.<.li>
3. Extending Core Duration
Most public DB plans use the Bloomberg U.S. Aggregate Bond Index to guide the implementation and measure the performance of their core bond allocations. But we think plan sponsors may want to consider whether that index’s characteristics, particularly its duration, are appropriate for them.
We see several reasons for plan sponsors to lengthen the duration of their liquid fixed income allocations and reconsider the sector mix in their core bond allocations:
- While duration has remained relatively stable in many U.S. public DB plan portfolios, dollar duration has declined significantly as allocations to public fixed income have declined.
- Many private credit strategies have relatively low duration because of their underlying exposure to floating rate loans.
- Lower duration and greater credit (and equity) exposure both have the potential to perform poorly during a risk‑off event and a flight to quality, leaving plans more exposed to downside risk.
- The shift from public to private fixed income in plan portfolios is likely to have concentrated credit risk in corporate bonds. This creates a potential opportunity to diversify credit risk by raising exposure to other fixed income sectors, such as securitized bonds.
Additionally, since duration can be extended using derivative instruments, plans that have the ability to do so may want to consider redeploying capital into other strategies, such as the more flexible dynamic bond vehicles mentioned above.
Conclusions
In our view, there has never been a more important time for investors to reexamine their asset allocations to see if return targets can be achieved with more diversified portfolios. This is particularly true considering that many current allocation policies were influenced by an economic environment that is very different from the one we are in today.
We also believe that the asset allocation changes that have taken place over the past 15 years, combined with a wide range of implementation approaches, may warrant a total portfolio approach that looks across asset classes to capture equity and fixed income exposures that may reside outside their respective asset classes. In our view, taking these steps will allow for more precise measurement of key exposures, thus reducing the likelihood of unexpected outcomes regardless of how asset classes perform going forward.

IMPORTANT INFORMATION
This material is being furnished for general informational purposes only. The material does not constitute or undertake to give advice of any nature, including fiduciary investment advice, and prospective investors are recommended to seek independent legal, financial and tax advice before making any investment decision. T. Rowe Price group of companies including T. Rowe Price Associates, Inc. and/or its affiliates receive revenue from T. Rowe Price investment products and services. Past performance is not a reliable indicator of future performance. The value of an investment and any income from it can go down as well as up. Investors may get back less than the amount invested.
The material does not constitute a distribution, an offer, an invitation, a personal or general recommendation or solicitation to sell or buy any securities in any jurisdiction or to conduct any particular investment activity. The material has not been reviewed by any regulatory authority in any jurisdiction.
Information and opinions presented have been obtained or derived from sources believed to be reliable and current; however, we cannot guarantee the sources' accuracy or completeness. There is no guarantee that any forecasts made will come to pass. The views contained herein are as of the date noted on the material and are subject to change without notice; these views may differ from those of other T. Rowe Price group companies and/or associates. Under no circumstances should the material, in whole or in part, be copied or redistributed without consent from T. Rowe Price.
The material is not intended for use by persons in jurisdictions which prohibit or restrict the distribution of the material and in certain countries the material is provided upon specific request.
It is not intended for distribution to retail investors in any jurisdiction.
Canada—Issued in Canada by T. Rowe Price (Canada), Inc. T. Rowe Price (Canada), Inc.’s investment management services are only available to Accredited Investors as defined under National Instrument 45-106. T. Rowe Price (Canada), Inc. enters into written delegation agreements with affiliates to provide investment management services.
© 2023 T. Rowe Price. All rights reserved. T. ROWE PRICE, INVEST WITH CONFIDENCE, and the bighorn sheep design are, collectively and/or apart, trademarks or registered trademarks of T. Rowe Price Group, Inc.

Lowell Yura is the head of Multi-Asset Solutions, North America in the Multi-Asset Division of T. Rowe Price. Mr. Yura and his team engage clients and prospects in North America in consultative discussions to identify how T. Rowe Price can best meet their investment needs and objectives through the firm's broad equity, fixed income, and asset allocation investment capabilities. Mr. Yura is a vice president of T. Rowe Price Associates, Inc., and T. Rowe Price Group, Inc.