May 2024 / ASSET ALLOCATION
Let’s get real (about interest rates)
Higher real rates in the coming years might favor value stocks
As I was driving home recently, I called Charles Shriver. We were talking about this Special Topic when he said something quite clever. It perfectly captured how to think about interest rates in the future.
Before I tell you what he said, let me provide some background:
Charles is a portfolio manager and cochair of the Asset Allocation Committee (AAC). We work together on all of our AAC Special Topics. He’s a fantastic investor, collaborator, and sounding board.
Prior to our conversation, Charles and I had asked Cesare Buiatti, senior quantitative investment analyst, to backfill the history of real interest rates—in other words, interest rates with inflation stripped out—in the United States by historical regime.
Cesare estimated the average real rate during each of the following regimes:
1. Postwar Boom (1955–1969)1
This era of prosperity had the strongest economic growth and the lowest unemployment of our four regimes. Inflation was also low, in the 2% range. Automation technologies and a broadening labor force that included more women, minority groups, immigrants, and globalization drove significant productivity gains.
2. Stagflation (1970–1981)
During the Stagflation regime, inflation spiked due to supply shocks, even when demand was weak because of economic stagnation. Inflation was high and often unanchored—in other words, consumers did not expect it to be temporary. Growth in gross domestic product (GDP) was low and unstable.
3. Old Normal (1982–2007)
The steady decline in interest rates was the defining feature of this era. Economic growth and inflation were “normal,” at about 3% each. Capital markets outperformed the economy due to rising valuations and cheap leverage.
4. New Normal (2008–2019)
After the global financial crisis (GFC), we entered an era of extremely accommodative central bank policy. In the New Normal, the economy got stuck in neutral, with low rates, low growth, and low inflation. This regime ended with the coronavirus pandemic.
It’s difficult to define the current regime as we unwind pandemic distortions.
What did Charles say?
As I was white-knuckling the four-lane transition on Light Street to make a right on Conway, with my head turned toward the car’s blind spot, I asked Charles what Cesare’s results looked like.
His answer, like a TV jingle or a Taylor Swift song, has been an earworm stuck in my brain since this conversation:
“The New Normal was abnormal.”
It was indeed. The table below shows the average real rate by regime. To estimate the real rate, we remove inflation expectations.
Average 10-year real rate by historical regime
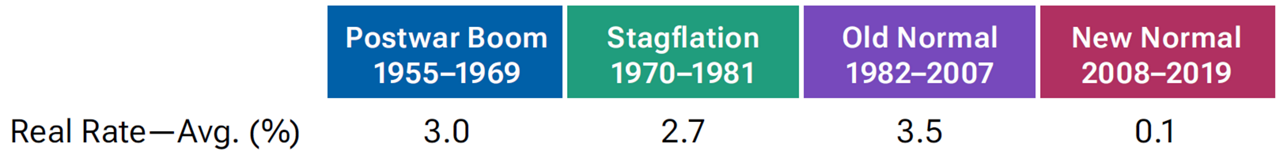
Sources: Federal Reserve Board, Federal Reserve Bank of Philadelphia, University of Michigan. Analysis by T. Rowe Price. Real rates are equal to the difference between the 10-year nominal U.S. Treasury yield and expected inflation. The latter is computed as the average of Livingston 1-Year Inflation Expectations, University of Michigan 5-Year Inflation Expectations, and Survey of Professional Forecasters 10-Year Inflation Expectations (from January 1955 to March 1990), as well as the average of the last two only from April 1990 to December 2019.
It’s counterintuitive to classify an entire 11-year period as abnormal. However, the global financial crisis transformed monetary policy. Zero interest rates simply can’t be “normal” if you believe in the time value of money.
Therefore, I expect that over the next decade, real rates will remain higher than they were during the prior decade. The pandemic served as the reset button. “The pandemic was a shock that created a new inflation equilibrium,” said a committee member, who added, “China now may be masking this shift a bit.”
You might disagree with that view. Let me try to argue both sides:
Why we could go back to the New Normal
An aging population puts downward pressure on productivity, as does high government debt (more on this topic later). All else equal, lower productivity means lower growth and lower real rates.
However, artificial intelligence (AI) could offset these factors. One of my colleagues described AI as “the greatest boost to human productivity since electricity.” While he may be prone to superlatives, the venerable consulting firm McKinsey & Company agrees with him. From their report titled, “The Economic Potential of Generative AI: The Next Productivity Frontier”:
Our latest research estimates that generative AI could add the equivalent of $2.6 trillion to $4.4 trillion annually across the 63 use cases we analyzed—by comparison, the United Kingdom’s entire GDP in 2021 was $3.1 trillion. This estimate would roughly double if we include the impact of embedding generative AI into software that is currently used for other tasks beyond those use cases.2
You might counter that AI will be deflationary because robots will replace humans. However, we’re looking at real rates (excluding inflation) here. Also, every technological innovation in history was thought to replace human jobs and became additive to employment by creating new jobs.
Here are some thoughts our Chief International Economist Nikolaj Schmidt recently shared with me:
The post-GFC period was the outlier. In my view, the story is quite simple: The post‑GFC period was the Great Deleveraging. Whenever U.S. households (and households, governments, and corporations in the rest of the world) had an extra dollar, they used it to pay off debt. Consequently, we were caught in a world of excess savings and deficit demand. To avoid a downward spiral (falling demand leading to falling employment, which causes a further decline in demand), central banks had little choice but to run ultra-loose monetary policy. In my view, this is [famous bond investor Mohamed] El-Erian’s New Normal—and I suspect that it was a much better description of the world relative to the Secular Stagnation thesis. The distinction between the two is obviously important because they have very different implications for the path we are on today. (We should not dismiss the Secular Stagnation thesis, but it was just less important relative to the New Normal.)
Another factor that could sustain higher real rates is the return to a more normal term premium. In a “normal” economic environment, investors should require compensation for taking on interest rate risk.
What this means for investors
Economists have strong views on this debate, especially those who opine from the ivory tower about “equilibrium.” Their theoretical tool set includes elusive concepts such as potential GDP and “r-star”—the interest rate level at which the economy is growing at full speed and inflation remains stable.
Charles, Cesare, and I took a different approach. First, we focused on investment implications.
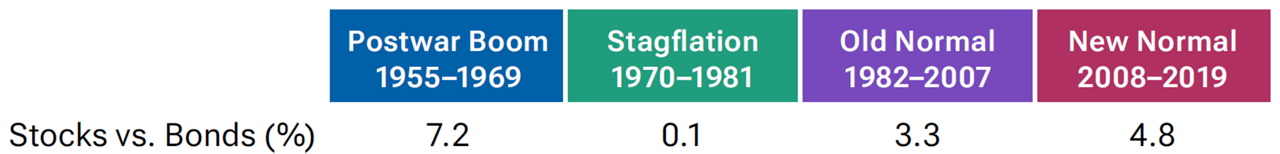
Based on historical equity risk premia numbers, we found plenty of oxygen for stocks to outperform bonds when real rates were in the 3% range, as shown below. The Postwar Boom was fantastic for stocks relative to bonds as productivity skyrocketed. The Old Normal was also good for both stocks and bonds due to declining rates.
The exception was the Stagflation regime, during which oil shocks roiled stock markets. Stagflation wasn’t a happy regime.
Stocks versus bonds average annual returns by regime
Past performance is not a reliable indicator of future performance.
Sources: S&P, Bloomberg LP, Morningstar. Analysis by T. Rowe Price, based on the following benchmarks: S&P 500 Index from January 1955 to December 2019 (Stocks), Ibbotson SBBI U.S. Intermediate-Term Government Bond Index from January 1955 to December 1975, and Bloomberg U.S. Aggregate Bond Index from January 1976 to December 2019 (Bonds).
Next, we looked under the surface at asset class pairs. One trade stood out. By historical standards, Charles’s jingle “the New Normal was abnormal” applies to this trade.
The trade is value versus growth, as shown here:
Value versus growth average annual returns by regime

Past performance is not a reliable indicator of future performance.
Sources: Russell LSE, Fama-French Data Library. Analysis by T. Rowe Price, based on the following benchmarks: Fama-French Growth Factor from January 1966 to December 1978 and Russell 1000 Growth Index from January 1979 to December 2019 (Growth), Fama-French Value Factor from January 1955 to December 1978 and Russell 1000 Value Index from January 1979 to December 2019 (Value).
The historical outperformance of growth stocks feels “normal” because it’s been persistent for over 10 years. But if we widen the aperture and consider academic research on the value premium, we find that value stocks have outperformed growth stocks in the (very) long run. In a normal environment, investors require a risk premium to invest in the more cyclical parts of the economy, such as banks and commodities, which are more heavily represented in the value universe.
(To be sure, there are different definitions of “value.” Index providers don’t necessarily do a great job at parsing the universe—another reason to favor skilled active management over index-based investing. “Value investing” means, in general terms, buying companies that trade at a cheaper valuation.)
During the New Normal, economic growth was anemic. Large tech companies grew revenues beyond the level of GDP growth. They were, and remain, less tied to the economic cycle. Hence, they did better than value companies in this era of stagnant growth. Also, 0% rates encouraged risk taking. If your cost of capital is zero, you may invest in more speculative projects. You may be less concerned about debt service as much as when interest rates are higher. “Zero rates created Tesla,” a colleague said.
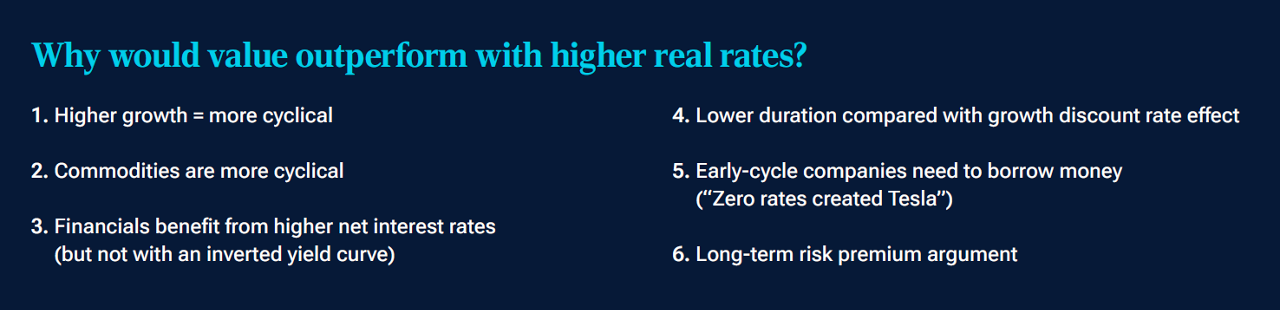
Our analysis shows that we can loosely associate higher real rates with historical value outperformance over growth. The list above provides some possible explanations.
However, AI innovation and benefits of scale for tech platform companies may continue to boost returns for growth stocks. “The role of innovation favors growth,” said a committee member.
My tactical view is that rates may surprise on the upside this year. Meanwhile, growth stocks are trading at high valuations relative to value stocks, as shown below.
Growth premium to value
Relative forward price/earnings ratio of Russell 1000 Growth Index divided by Russell 1000 Value Index
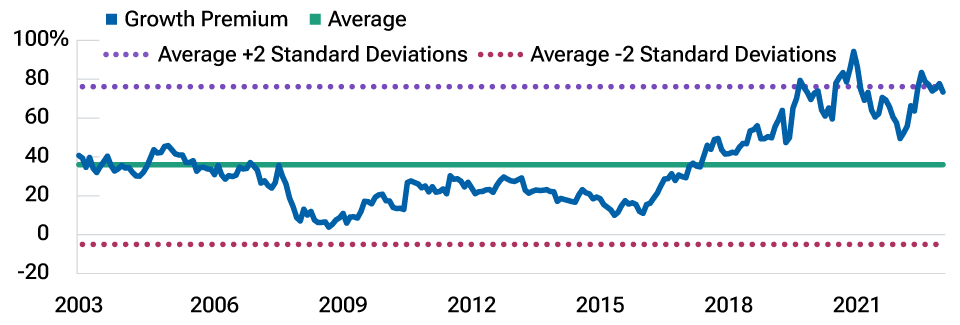
20 years ended December 31, 2023 (monthly observations)
Source: Russell LSE. Analysis by T. Rowe Price.
The revenue growth advantage of growth stocks appears priced in; the upside risks to rates and commodities are not. Economic growth may also surprise on the upside—after all, it’s an election year, and election years typically see efforts to juice the economy. Recent economic data also indicate economic momentum.
Hence, I recommended to the AAC that we continue to add incrementally to value stocks.
What real rates should we expect going forward?
Focusing on long-term considerations, if the New Normal was abnormal, what’s the level of real rates we could expect going forward? To answer this question, we returned to a prior analysis that mapped current economic conditions to prior regimes. This analysis assigned probabilities to each regime, allowing statements such as “There’s a 65% probability that we are in the Old Normal.”
Regime probabilities
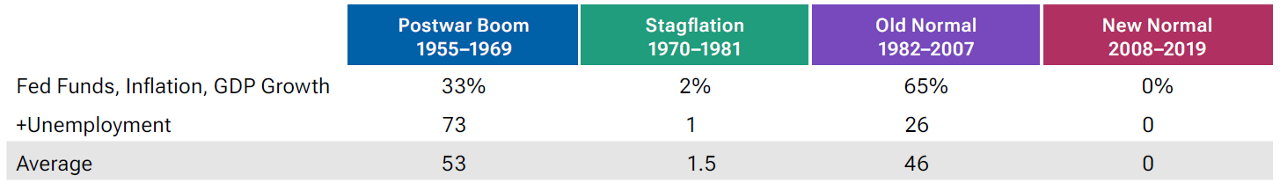
Sources: Federal Reserve, Bureau of Labor Statistics, Bureau of Economic Analysis. Analysis by T. Rowe Price. Fed Funds is the effective fed funds rate, Inflation is the annual change in the consumer price index and includes all items. GDP Growth is the seasonally adjusted, annual change in U.S. real GDP. Unemployment is the seasonally adjusted U.S. civilian unemployment rate.
The table above shows the probabilities based on two models. The first model compares the current level of the fed funds rate, inflation, and growth with the averages during historical regimes using an advanced statistical method that accounts for the interaction between these variables. The second model does the same, but adds unemployment as a fourth variable. Unemployment is so low, it’s most similar to the Postwar Boom. Hence, the probability of that regime increased when we added unemployment to the model.
Then, we multiplied these probabilities—taking the average of the two models by the average level of real rates in each regime.
Using this methodology, the implied real rate is 3.2%.
We can do the same for the value premium. Multiplying our regime probabilities by the value versus growth premium under each regime, we get an implied value premium of 2%.
To be clear, this is a backward-looking analysis. We’re in a new regime. The next 10 years will look and feel different from anything we’ve seen in the past. Nonetheless, I expect something more similar to the three regimes before the New Normal (insert Charles’s jingle here)—higher real rates and perhaps a return of the long-lost value premium.
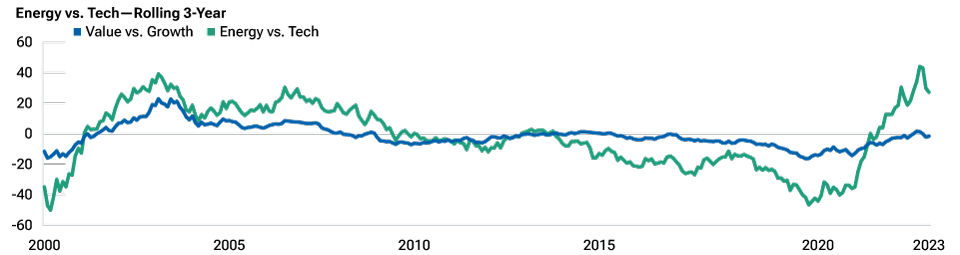
I would not, however, write off growth stocks. We need balance. A moderate overweight to value for the next six to 18 months seems appropriate for the AAC. Ultimately, since 2000, the value versus growth trade has been explained, in great part, by the energy versus technology trade, as shown below. Energy demand is rising, supply is getting more constrained, and the green transition will require patience and significant investments. These factors should favor energy companies, especially to the extent they contribute to the green transition.
Yet, I’m not prepared to make a secular bet against AI and large tech companies.
The value trade since 2000
A sector proxy for the value vs. growth trade
January 2000–December 2023
Past performance is not a reliable indicator of future performance.
Sources: Russell LSE, Fama-French Data Library. Analysis by T. Rowe Price, based on the following benchmarks: Russell 1000 Growth Index (Growth), Russell 1000 Value Index (Value), Fama-French Energy Industry Portfolio (Energy), Fama-French High Tech Industry (Tech).
What about high government debt? It’s complicated.
The number one pushback to this entire analysis may be that government debt is extremely high, which could put downward pressure on real rates and economic growth. The table below shows that the U.S.’s debt/GDP ratio is currently much higher than during prior regimes. (The only time it was comparable was right after World War II, not shown here.) It was 98% as of the end of 2019, and it’s 126% now.
Debt/GDP ratio by regime

Source: Office of Management and Budget. Analysis by T. Rowe Price.
Academic research shows that a high debt/GDP ratio does push rates higher, but the magnitude is small (0.0038% per 1% increase in debt/GDP).3
The research on the link between high government debt and subsequent growth is slightly controversial.4 A famous multi‑country study by Carmen Reinhart and Kenneth Rogoff linked debt ratios of 90% of GDP with an average subsequent growth of -0.1%.5 However, the authors made an Excel error. They omitted five rows in an average formula. A subsequent study estimated the growth number at 2.2%.6 Oops. A high debt/GDP ratio doesn’t necessarily mean subsequent economic doom.
But the story doesn’t end there. Additional research since then has validated Reinhart and Rogoff’s thesis that growth falls when debt/GDP passes a certain level.7
But wait, there’s more. Other research shows that “pro-market” countries, such as the United States, can support a higher level of debt without impairing growth (enter AI and productivity gains).8
I’m in the middle on this debate. Government debt is so high that taxes will likely increase, and spending must slow. The Fed is independent, but debt service costs (the interest paid on the debt) are rising so fast that bringing rates down may become imperative to support the country’s fiscal health. In this sense, higher government debt levels might paradoxically put a ceiling on how high rates can go. Thankfully, household and corporate debt levels remain low relative to history, especially when you adjust for asset levels.
Takeaways
This analysis covered both the short-term (tactical) and long-term (strategic) horizons. Tactically, it supports the AAC adding to value stocks given the potential upside to rates and inflation and the valuation advantage of value over growth.
From a long-term perspective, the conclusion is similar. The return of gravity in financial markets—in other words, positive real rates—may usher in the return of the value premium. However, my conclusion is not that we should abandon growth stocks. I’m arguing for balance, with a tactical tilt to value following an incredible rally in growth.
The most important takeaway remains, of course, that “The New Normal was abnormal.” You’ll have this sentence in your head all day. You’re welcome.
Certain assumptions have been made for modeling purposes, and this material is not intended to predict future events.
Definitions:
Premium/discount indicates whether a security is currently trading above (at a premium to) or below (at a discount to) its net asset value.
Price/earnings ratio measures share price compared with earnings per share for a stock or stocks in a portfolio.
Real rates are equal to the difference between the 10-year nominal U.S. Treasury yield and expected inflation.
Standard deviation measures historical volatility. Higher standard deviation implies greater volatility.
Additional Disclosure
London Stock Exchange Group plc and its group undertakings (collectively, the “LSE Group”). © LSE Group 2024. “FTSE®” “Russell®”, and “FTSE Russell®” are trade mark(s) of the relevant LSE Group companies and are used by any other LSE Group company under license. All rights in the FTSE Russell indexes or data vest in the relevant LSE Group company which owns the index or the data. Neither LSE Group nor its licensors accept any liability for any errors or omissions in the indexes or data and no party may rely on any indexes or data contained in this communication. No further distribution of data from the LSE Group is permitted without the relevant LSE Group company’s express written consent. The LSE Group does not promote, sponsor or endorse the content of this communication. The LSE Group is not responsible for the formatting or configuration of this material or for any inaccuracy in T. Rowe Price’s presentation thereof.
IMPORTANT INFORMATION
This material is being furnished for general informational and/or marketing purposes only. The material does not constitute or undertake to give advice of any nature, including fiduciary investment advice, nor is it intended to serve as the primary basis for an investment decision. Prospective investors are recommended to seek independent legal, financial and tax advice before making any investment decision. T. Rowe Price group of companies including T. Rowe Price Associates, Inc. and/or its affiliates receive revenue from T. Rowe Price investment products and services. Past performance is not a reliable indicator of future performance. The value of an investment and any income from it can go down as well as up. Investors may get back less than the amount invested.
The material does not constitute a distribution, an offer, an invitation, a personal or general recommendation or solicitation to sell or buy any securities in any jurisdiction or to conduct any particular investment activity. The material has not been reviewed by any regulatory authority in any jurisdiction.
Information and opinions presented have been obtained or derived from sources believed to be reliable and current; however, we cannot guarantee the sources’ accuracy or completeness. There is no guarantee that any forecasts made will come to pass. The views contained herein are as of the date noted on the material and are subject to change without notice; these views may differ from those of other T. Rowe Price group companies and/or associates. Under no circumstances should the material, in whole or in part, be copied or redistributed without consent from T. Rowe Price.
The material is not intended for use by persons in jurisdictions which prohibit or restrict the distribution of the material and in certain countries the material is provided upon specific request. It is not intended for distribution to retail investors in any jurisdiction.
May 2024 / FIXED INCOME

Sébastien Page is head of Global Multi-Asset and chief investment officer. He is a member of the Asset Allocation Committee, which is responsible for tactical investment decisions across asset allocation portfolios. Sébastien also is a member of the Management Committee of T. Rowe Price Group, Inc.