January 2024 / INVESTMENT INSIGHTS
Is the market broadening?
Will small-caps eventually “show up” for investors?
Key Insights
- Even contrarians are beginning to question whether it’s worth the wait for small‑caps to make their comeback relative to large-caps.
- The overall quality of small-caps has plummeted as many newer firms have chosen to remain private, suggesting reason for caution.
- Nevertheless, small-caps remain extraordinarily cheap relative to large-caps, providing opportunities to careful active investors.
For those who aren’t familiar, two characters in Samuel Beckett’s famous play engage in a conversation while waiting for a third, named Godot. The entire play unfolds, and Godot never arrives.
As for those of us waiting for small-caps to outperform and the valuation spread between small- and large-caps to revert to the mean, are we waiting for Godot?
Within the five minutes it will take you to read this article, I’ll try to convince you both to hate—and to love—U.S. small-caps.
A long wait
The “hate” part shouldn’t be too hard, as relative valuations show that most investors prefer large-caps over small‑caps.1 Who wants to be overweight small-caps when growth is slowing? Conventional wisdom says you should own them during the early phase of the economic cycle, when we are coming out of a recession.
Even contrarians like us are questioning whether it’s worth the wait. Small-caps have been cheap relative to large-caps, but the valuation spread hasn’t reverted in years. On a relative basis, small-caps have gotten cheaper, and cheaper, and cheaper.
There’s a reason why the valuation signal hasn’t worked. It relates to something asset allocators often ignore. I wrote about it in my book Beyond Diversification—What Every Investor Needs to Know About Asset Allocation, published by McGraw Hill, November 2020—the two asset classes have changed over time.
The most unstable sector weight in the S&P 500 Index—the usual proxy for large-caps—has been technology.2 From 6% of the index in 1990, tech reached a peak of 29% in 1999, during the dot-com mania. Then it declined back to a trough of 15% in 2005. With the rise of the Magnificent Seven,3 it now stands at 29% again. (But don’t panic—the tech sector of today is much more profitable than it was in 1999.)
As tech’s weighting in the index has risen, large-caps have become less exposed to cyclical sectors. In November 2007, before the global financial crisis, the financials and energy sectors represented 31% of the index. These two sectors now represent only 17% of the index as of November 2023. Sector weights for industrials and materials have gone down over this period, too.
The opposite has happened with small-caps—they’ve become more cyclical and less tech-heavy. The chart below shows the trend in the relative weights of key sectors for small- versus large-caps since the global financial crisis. (Here I use the S&P 600 Index to represent small-caps, but the picture looks almost identical for the Russell 2000 Index.)
Small-caps vs. large-caps: relative sector weights
(Fig. 1) October 2008 to November 2023
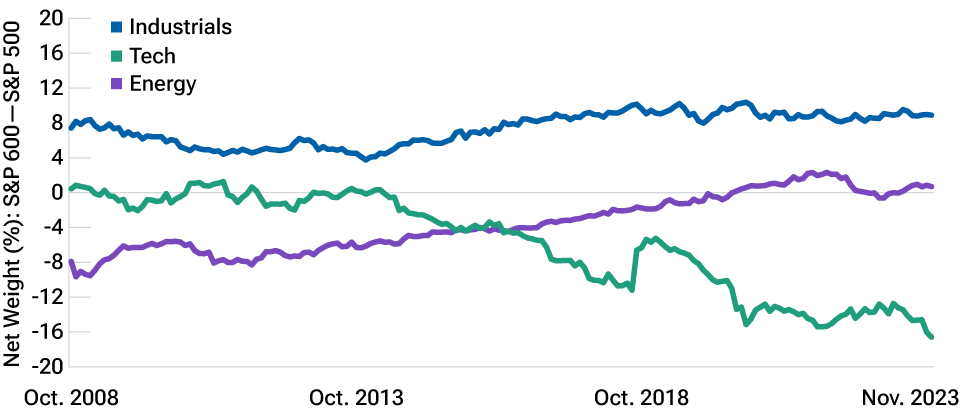
Source: Bloomberg Finance L.P.
Small-caps have further cheapened relative to large-caps in price/earnings (P/E) terms—in other words, the spread hasn’t reverted—in great part because of this drift in sector composition. The more tech-heavy the index, and all else remaining equal, the higher the earnings growth. And the higher the earnings growth, the higher the “natural” P/E. Waiting for the valuation spread to revert when the indexes are evolving in this way could be like waiting for Godot.
My colleague Peter Stournaras, who runs our Integrated Equity Division, which specializes in blending quantitative and fundamental research for stock picking, has highlighted other related, long-term issues with small-caps.
For example, in the Russell 2000, the percentage of “nonearners” has increased over time. Nonearners are companies that are losing money. Some of them might grow to become profitable. Others might be headed toward bankruptcy.
In the U.S., there used to be over 8,000 public companies in 2000, or 7,000 excluding the large-cap Russell 1000 Index. Typically, the smaller the company, the lower it scored on “quality” metrics such as earnings and return on equity (ROE). The cream tended to rise to the top of market cap ranking. Among those 7,000 companies, the 2,000 largest scored high in ROE.
But now, there are only about 2,700 public companies outside the Russell 1000, and the proportion of small nonearners is higher. The number of quality small public companies has plummeted because many of them have chosen to remain private. Why is that? Well, I can think of at least two reasons:
- a tsunami of money has flooded private equity; and
- the regulatory and reporting requirements for public companies have increased.
Hence, since only 700 public companies are now excluded, being part of the Russell 2000 signifies much less than it used to; in other words, if you’re a small public company, your chances of being included in the Russell 2000 are nearly three in four. As a further indicator of their lower quality, fewer small-cap companies have been acquired or have graduated to become large-caps.
Although he sees opportunities for active management in the quality segment of small‑caps (more on this distinction shortly), Peter explains that passive index buyers should be careful because the Russell 2000 Index is “scraping the bottom of the barrel.” The median Altman Z-Score, a measure of default risk, for Russell 2000 companies is near an all-time low, which indicates that default risk is near an all-time high.4
Peter highlights another long-term issue with small-caps: In corporate America, the winner-takes-all effect has increased over time. Sales concentration across industries has increased due to the barriers to entry around large intangibles, such as intellectual property, as well as data and tech platforms. Think about how the Magnificent 7 are dominating online retail, digital advertising, cloud computing, chips, and artificial intelligence (AI).
Do you hate small-caps yet? And how could I ever convince you to love them?
First, small-caps are not just cheap relative to large-caps, they’re extraordinarily cheap. In financial markets, it can pay to go against the consensus. The chart below shows that small-caps are trading at a 50% discount, and most of that discount has been built up over the last five years. I believe this spread is driven by more than the long‑term headwinds against small-caps—the Magnificent 7, sentiment, and positioning are all playing a role.
Small-caps vs. large-caps: valuation discount
(Fig. 2) January 1994 to November 2023
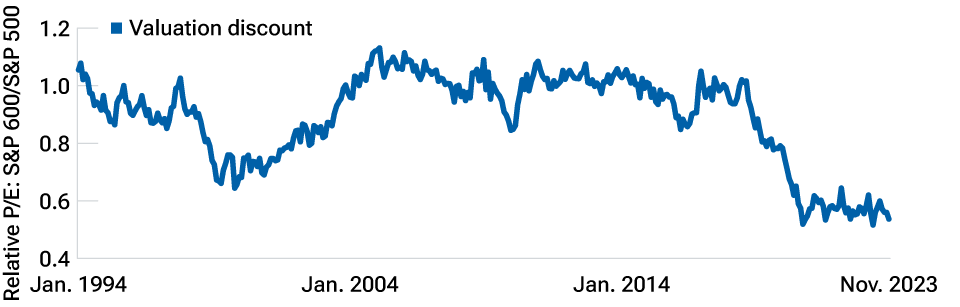
Source: Median P/E for S&P 600 and S&P 500 are computed by T. Rowe Price.
While the valuation signal has not been effective in general, it has worked well when at an extreme. I call it the “coiled spring” effect.
The table below shows that from January 1994 to November 2023, the average forward 12-month (12M) returns for small-caps (S&P 600) versus large-caps (S&P 500), when small-caps were in the bottom quintile (Q5), was 8.9%. Today, we are deep into Q5.
Historical performance of small-caps vs. large-caps based on relative valuation
(Fig. 3) January 1994 to November 2023
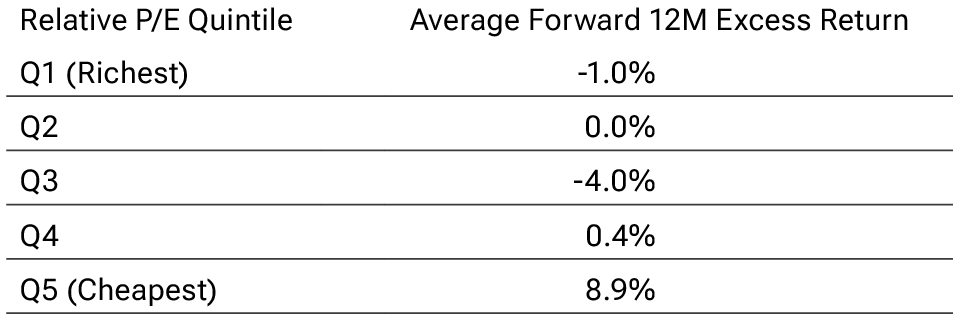
Sources: Median P/E for S&P 600 and S&P 500 are computed by T. Rowe Price. Total return series are sourced from Bloomberg. Past performance is not a reliable indicator of future performance.
What’s the catalyst that could unleash small-caps? Historically, small-caps have outperformed when the Fed was cutting rates. Fed cuts stimulate the economy, and small-caps are more cyclical than large-caps.5
Small-caps vs. large-caps and the Fed cycle
(Fig. 4) January 1994 to November 2023
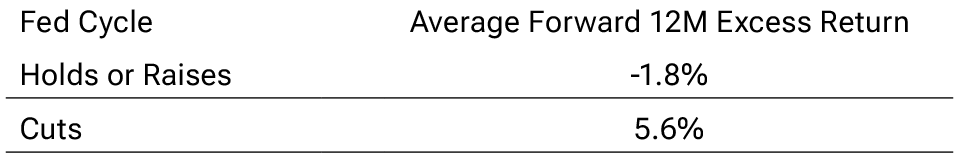
Source: Bloomberg Finance L.P. Analysis by T. Rowe Price. Past performance is not a reliable indicator of future performance.
Fed cuts are expected in 2024. A skeptic might counter that the environment is different this time. Growth is likely to continue to slow, not accelerate. Unless we get a recession, the Fed is unlikely to cut interest rates to stimulate the economy. The Fed is likely to cut because inflation is coming down, and it doesn’t want real rates (nominal interest rates minus inflation) to become too restrictive.
Still, small-cap companies have more short-term debt than large-caps. Therefore, they should get more relief from declining short rates.6
My view is that the strong valuation—the Q5 “buy” signal—combined with the macro signal of declining rates, justify an overweight small-caps position in our tactical asset allocation.
And there’s a third reason to like (maybe even love?) small-caps: the opportunity for skilled active management. The asset class has been so hated that quality companies have been unfairly dragged down with it. Investors have thrown the babies out with the bathwater, in my view, and quality in small-caps is trading cheap relative to quality in large-caps.
We like the S&P 600 more than the Russell 2000 as an index of small-caps because the S&P 600 excludes nonearners. It has outperformed the Russell 2000 by 140 basis points per year over the last 20 years ended 2023. The definition of quality is in the eye of the beholder,7 but it’s clear that the S&P 600 is composed of higher-quality stocks than the Russell 2000 as measured by ROE.
Suppose we use return-on-equity (which is net income divided by book value) as a measure of quality. The chart below shows the distribution of ROEs across stocks in each index. The S&P 600 distribution is shifted to the left, which means that it has more companies with lower ROEs than the S&P 500.
Distributions of ROEs in small-caps vs. large-caps*
(Fig. 5) As of November 30, 2023
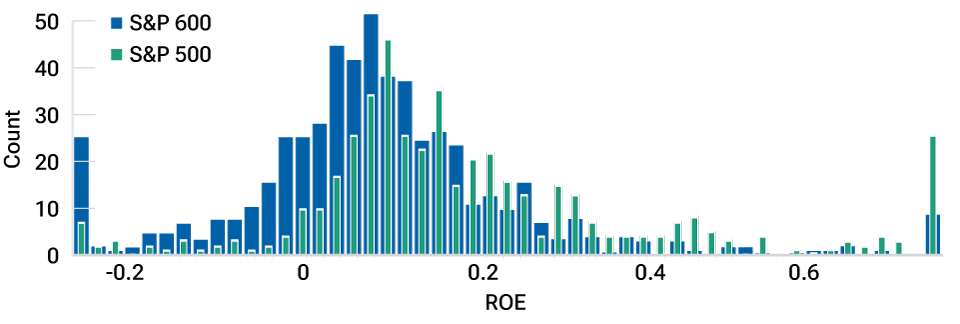
Source: T. Rowe Price Integrated Equity Division.
* There are negative ROE values in the S&P 600 because the criterion requires positive earnings at the time of inclusion only.
But there’s overlap in the distributions. Many small-caps have higher ROEs than many large-caps. Imagine two classes of students taking the same course, given by the same professor. Suppose the average grade is lower in one of the two classes. Still, many students in this underperforming class will have a higher grade than many students in the other class.
I believe the market has missed this distinction. Quality looks cheaper in small-caps than in large-caps. I suspect the rise in index investing has contributed to this spread. For an example of how passive investing creates such distortions, find “The Revenge of the Stock Pickers,” which was published in the Financial Analysts Journal (2019), where my colleagues and I discuss the impact of exchange-traded fund flows on stock-picking opportunities.
Below are two tables to support this statement. In the first, I rank securities in the S&P 600 and the S&P 500 to create high-, medium-, and low-quality buckets. These buckets contain securities of roughly similar ROEs.
Comparing similar ROE companies in small-caps vs. large-caps
(Fig. 6) As of November 30, 2023
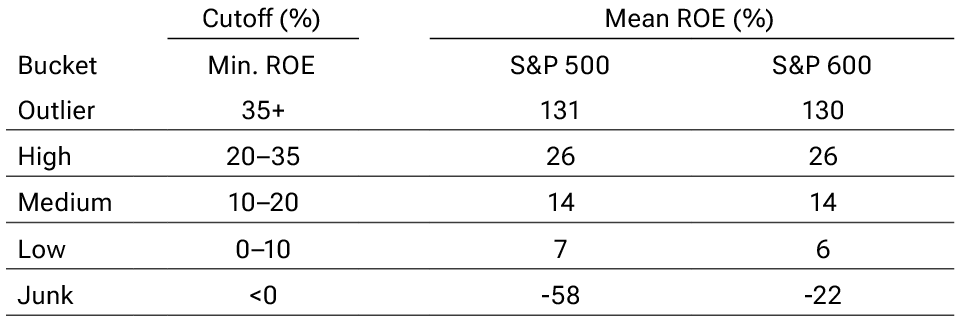
Source: T. Rowe Price Integrated Equity Division.
In the second, I compare the price-to-cash flows (P/CFs) for each bucket, in small‑ versus large-caps.
Comparing similar ROE companies in small-caps vs. large-caps
(Fig. 7) As of November 30, 2023
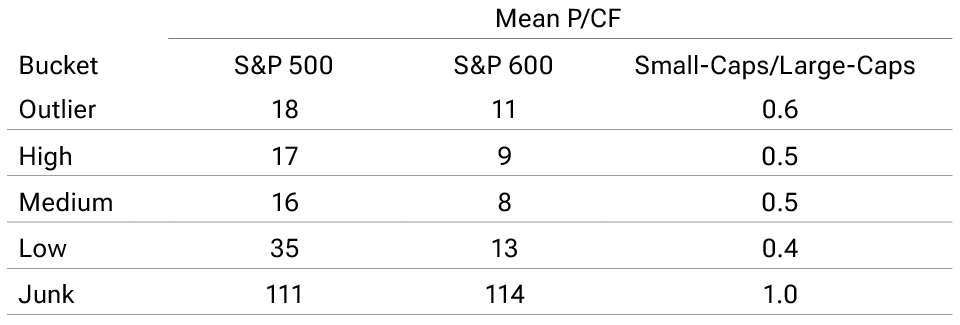
Source: Mean P/CF for S&P 600 and S&P 500 are computed by T. Rowe Price.
High-quality stocks in the S&P 600 are trading at a 50% discount to stocks with similar ROEs in the S&P 500, in terms of P/CF (and a 40% discount in terms of P/E—not shown).
For an investor with a 12- to 18-month horizon, as interest rates come down and if small-caps outperform, it’s possible that we’ll see a “junk” rally. Nonearners may “pop.” However, with growth slowing, in terms of risk-adjusted return at a time horizon of 12 to 18 months, my view is that quality small-caps offer the best opportunity. We do like innovative, fast‑growing, disruptive companies in some of our strategies, but overall, our Asset Allocation Committee gets most of its small-cap exposure in a way that emphasizes quality and that resembles the S&P 600 more than the Russell 2000.
Last, here are a few more arguments in favor of small-caps from a tactical perspective:
- They’re more domestic, with greater exposure to the U.S. economy compared with large multinationals. Growth appears stronger in the U.S. than in most of the rest of the world heading into 2024.
- If other central banks, such as the European Central Bank, lower rates at a faster pace than the Fed, the U.S. dollar could appreciate. Large-caps would suffer more than small-caps from the repatriation of foreign earnings.
- I’m not a big proponent of technical analysis and calendar effects, but there’s some evidence that, historically, small-caps have done better than large-caps in January.8 In the same vein, small-caps have historically outperformed during election years.
Small-caps vs. large-caps and the election cycle
(Fig. 8) Presidential elections from 1994 to 2023

Source: Bloomberg Finance L.P. Past performance is not a reliable indicator of future performance.
From a super secular perspective, a committee member reminded us that “over a very long period of time, there’s been a small-cap premium. Investors need to get compensated for the liquidity risk.” Finance theory supports that argument.
Have I convinced you to love small-caps? Maybe as a tactical opportunity?
Our Asset Allocation Committee remains overweight small-caps versus large-caps. We’ll revisit this position as the relative valuation spread normalizes.
And yes, I need to admit that this article takes more than five minutes to read, and I hope you’ll forgive this bit of false advertising. But perhaps you found the wait was worth it?
There is no guarantee that any forecasts made will come to pass. The charts and tables are shown for illustrative purposes only. Certain assumptions have been made for modeling purposes, and this material is not intended to predict future events.
IMPORTANT INFORMATION
This material is being furnished for general informational and/or marketing purposes only. The material does not constitute or undertake to give advice of any nature, including fiduciary investment advice, nor is it intended to serve as the primary basis for an investment decision. Prospective investors are recommended to seek independent legal, financial and tax advice before making any investment decision. T. Rowe Price group of companies including T. Rowe Price Associates, Inc. and/or its affiliates receive revenue from T. Rowe Price investment products and services. Past performance is not a reliable indicator of future performance. The value of an investment and any income from it can go down as well as up. Investors may get back less than the amount invested.
The material does not constitute a distribution, an offer, an invitation, a personal or general recommendation or solicitation to sell or buy any securities in any jurisdiction or to conduct any particular investment activity. The material has not been reviewed by any regulatory authority in any jurisdiction.
Information and opinions presented have been obtained or derived from sources believed to be reliable and current; however, we cannot guarantee the sources’ accuracy or completeness. There is no guarantee that any forecasts made will come to pass. The views contained herein are as of the date noted on the material and are subject to change without notice; these views may differ from those of other T. Rowe Price group companies and/or associates. Under no circumstances should the material, in whole or in part, be copied or redistributed without consent from T. Rowe Price.
The material is not intended for use by persons in jurisdictions which prohibit or restrict the distribution of the material and in certain countries the material is provided upon specific request. It is not intended for distribution to retail investors in any jurisdiction.

Sébastien Page is head of Global Multi-Asset and chief investment officer. He is a member of the Asset Allocation Committee, which is responsible for tactical investment decisions across asset allocation portfolios. Sébastien also is a member of the Management Committee of T. Rowe Price Group, Inc.