March 2024 / INVESTMENT INSIGHTS
Dynamic credit investing: A Q&A With Saurabh Sud
Dynamic Credit’s flexible approach has been pivotal over different market conditions.
Key Insights
- Different market environments since 2019 highlight the importance of a strategy that is flexible and has access to differentiated sources of returns.
- The strategy employs a flexible, multi-asset credit approach to source opportunities from our research platform rather than focusing on one asset class.
- Using our full investment toolkit, including duration management and fundamental credit shorts, has been important to navigate multiple credit and interest rates cycles.
Saurabh Sud passed his five-year anniversary as portfolio manager of the Dynamic Credit Strategy. We discuss how he has managed the strategy since its inception in January 2019 through an extraordinary period of volatility for credit investors and fixed income markets. He talks about the successes and the lessons learned, and he describes his investment process and its emphasis on seeking attractive performance through finding diversified sources of credit returns across a broad opportunity set.
How would you describe your first five years as portfolio manager?
Looking over the past five years, I am pleased that we delivered on the strategy’s objectives through what was a quite volatile period, not just for equities but for fixed income more specifically. The composite fared well in each calendar year since its inception, which included two quite challenging market environments in 2020 and more recently in 2022. The coronavirus outbreak in 2020 and the ensuing economic shutdowns presented a trying backdrop for credit markets as liquidity was deeply challenged. Trading in many markets froze—even in normally liquid U.S. Treasuries—and credit spreads rose to levels not seen since the global financial crisis of 2008. Still, through our disciplined investment philosophy that emphasizes flexibility, we managed through the volatility and benefited from the ensuing sharp rebound in credit throughout the rest of 2020.
Later in 2022, the unprecedented pace and magnitude of rate hikes from the Federal Reserve (and other global central banks) led to significant losses across all fixed income sectors as bond yields surged and credit spreads widened. Even in this difficult rate environment, the composite was successful in its aim to provide downside support during times of market volatility and held up well relative to global aggregate bond and individual credit indices, which posted double-digit losses in calendar year 2022. While calendar year performance has been more challenged recently as the strategy’s cash-like benchmark has performed well on the back of strong demand, we believe the composite has performed as intended to benefit from the upsides of the fixed income credit markets while avoiding some of the downsides over a full market cycle.
We accomplished this by making full use of our investment toolkit, specifically going short duration in advance of a global interest rate hiking cycle and using our fundamental platform to generate short credit ideas that we believed could support on the downside.
While the past five years have posed the proverbial “trial by fire” for a credit-centric strategy, I think our performance speaks to the importance of our investment process and our team-oriented approach. Often, volatility can create investment opportunities, and I believe the vastly changing market backdrops since 2019 highlight the importance of a strategy that is flexible and aims to leverage the resources of our global fixed income platform to identify and invest in dislocated opportunities across all credit sectors.
The strategy’s repeatable process relies heavily on our global research platform of more than 300 people1—who collaborate across investment strategies, asset classes, and geographies—and flexibility across sectors has been important as markets changed since the inception of the strategy:
- As liquidity improved after the initial COVID-related sell-off, we targeted dislocations in investment-grade corporates. After spreads meaningfully improved, we then moved to sectors that were still dislocated but showed potential for improvement, such as high yield corporates, emerging market corporates, and convertibles.
- More recently, the representative portfolio increased allocations to sectors that typically respond positively to rising rate environments, specifically bank loans and securitized credit.
- At the end of 2023, we leaned in more to credit risk where we saw opportunities, but we remained vigilant with valuations at fair levels.
How would you describe your investment process and style?
The Dynamic Credit Strategy employs a flexible, cross‐sector approach to source opportunities from our global research platform. Rather than narrowly focusing on a specific asset class such as investment‑grade debt or emerging market bonds, this strategy can invest across all credit subsectors and instruments—including traditional bonds and synthetic securities like derivatives—in aiming to take advantage of pricing dislocations, liquidity advantages between derivatives and cash bonds, and compelling yield opportunities wherever they manifest.
The strategy’s alpha-seeking but risk‑aware approach is suitable for a range of market conditions. We believe that our fundamental credit analysis process that generates forward-looking insights from a global research platform with broad sector expertise can help us identify and capitalize on inefficiencies ahead of the market.
Many beta-centric credit allocations have tended to perform well in benign spread and rate environments while overlooking other market environments. As illustrated in Figure 1, the representative portfolio’s lower credit beta profile should allow it to hold up well in environments where credit spreads are widening, while its active duration management approach should be able to defend in rising interest rate environments. This framework was developed with a forward-looking view when the strategy was developed, and it has lived through all four quadrants since its inception.
The representative portfolio targets low correlation to equities and the traditional credit asset class. The value of the strategy’s focus on finding investment ideas with low correlations to traditional credit sectors is intended to help limit losses when markets decline. However, this is not just a downside mitigation strategy. We pursue solid upside capture while limiting downside capture over the long-term. As such, we believe the strategy can be utilized as a complement to investors’ current exposure to credit and fixed income to help diversify credit return streams. We believe that our approach to portfolio construction makes the strategy a compelling and consistent credit allocation, and its differentiated historical returns should also enable it to pair well with other credit allocations.
Credit exposure through multiple environments
(Fig. 1) Striving for more flexible, alpha-oriented outcomes
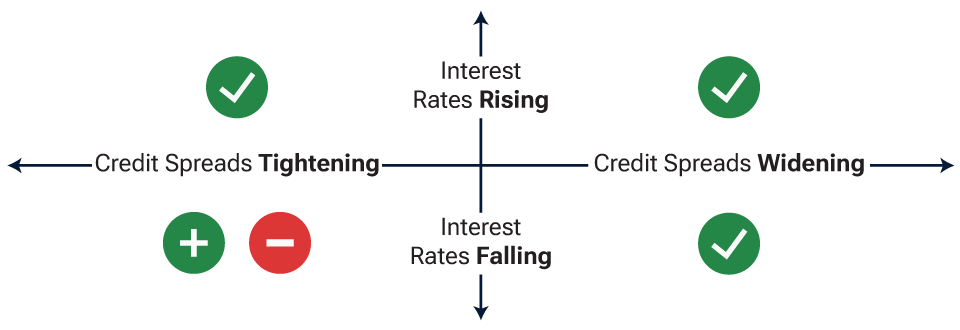
Source: T. Rowe Price.
Green icons represent expected outperformance versus credit beta; red icon represents expected underperformance. For illustrative purposes only.
The expected performance for the Dynamic Credit Strategy is relative to alternative credit indices, such as investment-grade corporates, high yield corporates, or emerging market bonds. Market environments and expected performance are based on the general strategy structure but are not based on actual performance nor intended as forward-looking performance projections. As with any investment, performance may vary and is subject to potential loss. Actual performance may differ significantly.
Performance under stressed market periods
(Fig. 2) Dynamic credit held up well during equity drawdowns
Return Analysis—Dynamic Credit Representative Portfolio
NET OF FEES—CUMULATIVE RETURNS
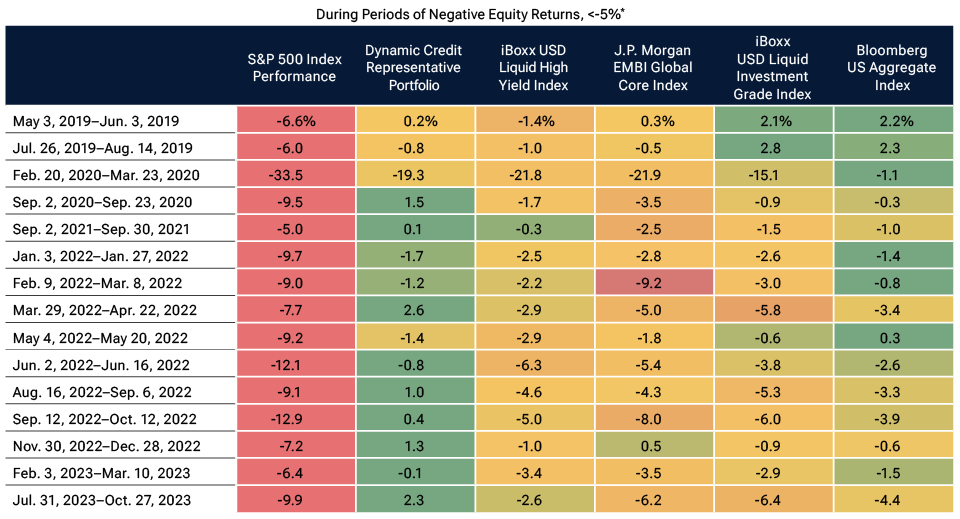
As of December 31, 2023.
Past performance is not a reliable indicator of future performance. Please see the end of the paper for additional information on the Representative Portfolio. Please see the GIPS® Composite Report for additional information on the composite.
Figures are shown in U.S. dollars. Performance figures are shown net of fees. The representative portfolio’s 1-year and since inception annualized returns, net of the highest applicable fee, were 4.22%, and 3.93% as of 31 December 2023.
*Periods selected represent accelerated negative moves greater than 5% in the S&P 500 Index (total return) where equity markets have fallen meaningfully in a short period of time (i.e., below 60 trading days).
Shading in table ranks the performance of each category during each drawdown period.
Source: © 2024 Refinitiv. All rights reserved.
Indexes shown represent beta credit returns and are benchmarks used by ETFs representing the Strategy’s Multi-Asset Credit – Long Exposure components: High Yield Bond, Emerging Market Bond, US Investment Grade Index and Bloomberg US Aggregate Bond Index, respectively. The ETF benchmarks are shown for illustrative purposes to demonstrate how each of the different sectors performed for the period when looking at passive indexes (peer proxies).
What makes Dynamic Credit different from other fixed income strategies at T. Rowe Price Associates, Inc. (TRPA)?
This question comes up often on how I differentiate the portfolio from other credit-focused investment strategies at TRPA when they draw from the same credit rating and conviction recommendations from our global research platform. The answer is that my approach is different. I apply a different filter and portfolio construction framework on top of our bottom-up analyst recommendations.
When collaborating with our analysts and credit sector experts—through informal and formal meetings on a daily, weekly, and monthly basis—and evaluating individual credits for potential portfolio inclusion as either long or short positions, I ask three key questions:
- Is there a catalyst that could cause the credit to outperform? Depending on the type of credit, this could be a range of factors, such as a potential credit rating upgrade or downgrade for a corporate credit. For consumer‑dependent credit like an asset-backed security (ABS) backed by auto loans, it could be an upturn in consumer payment trends.
- Is the position positively or negatively correlated with the performance of existing portfolio holdings? A meaningful negative correlation could indicate that the new position can provide diversification benefits by gaining when other exposures lose value.
- What is the asymmetry of the return profile? Essentially, will the price benefit more from a positive development than it suffers from a negative outcome—or vice versa? This can affect how a holding would fit into the representative portfolio’s overall positioning in terms of sizing, diversification, and potential alpha generation.
In addition to addressing these three factors, our investment process tries to ensure that we can get a premium for each position’s embedded credit beta, volatility, and liquidity. Our dynamic, flexible, and alpha-oriented approach enabled us to deliver differentiated performance in challenging markets. For example, in 2022, many credit bonds were not offering enough compensation for the interest rate volatility early in the year and helped us avoid drawdowns in those situations.
What have been your biggest investment successes? What have been your mistakes, and what lessons have you learned?
I think one of the most demonstrative successes for the strategy so far has been our performance during periods of significant weakness for riskier asset classes such as equities as shown in Figure 2.
Starting with the representative portfolio inception, we’ve analyzed drawdown periods for equity markets using the S&P 500 as a proxy. We then compared the performance of the representative portfolio relative to major credit and fixed income indices, and Dynamic Credit fared well during most of these periods and points to our emphasis on seeking attractive returns through up and down markets.
Moreover, I believe leveraging the strategy’s full toolkit—including long credit exposures, duration management, and active credit shorting—has been instrumental in its success through turbulent markets. To that point, one of the missteps in my time as portfolio manager happened in the second quarter of 2023, where we increased duration, believing that global central banks were at or near the end of tightening monetary policy. That move turned out to be premature as global rates continued to march higher and central banks maintained restrictive policy to combat stubbornly high inflation. However, the strategy’s flexibility allowed us to quickly move back to a negative duration position on an absolute basis. While the timing was not always right, our willingness and ability to make full use of duration management has helped dampen volatility and capture some upside in rising rate environments that are broadly deflating for fixed income.
Flexibility was important in 2020 as well. We underappreciated the impact that the coronavirus would have on global markets and global monetary policy by prematurely adding risk. As this macro view proved to be incorrect, our disciplined risk process allowed us to pivot away from this stance and be able to benefit from the sharp rebound in markets. While we experienced a sharp drawdown, we still outperformed high yield and emerging markets during the late February to late March 2020 drawdown period as seen in Figure 2 and finished the year with positive returns. As the strategy has matured since then, we have continued to implement and leverage our risk process and collaborate closely with other members of the fixed income platform.
Performance Table
Dynamic Credit (USD Hedged) Composite
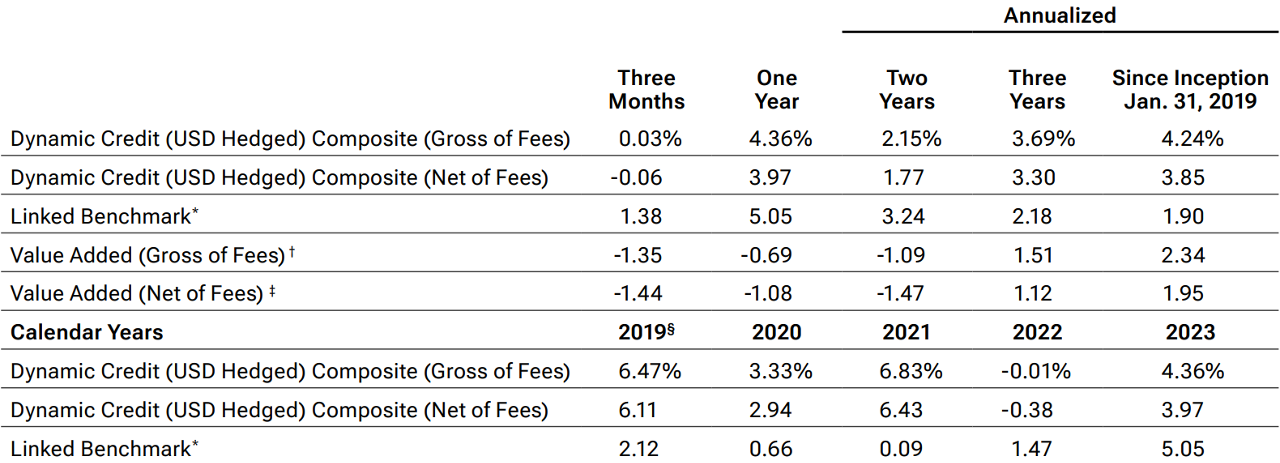
Past performance is not a reliable indicator of future performance.
Gross performance returns are presented before management and all other fees, where applicable, but after trading expenses. Net-of-fees performance reflects the deduction of the highest applicable management fee that would be charged based on the fee schedule contained within this material, without the benefit of breakpoints. Gross and net performance returns reflect the reinvestment of dividends and are net of all non-reclaimable withholding taxes on dividends, interest income, and capital gains.
*Effective 1 May 2021, the benchmark for the composite changed to ICE BofA US 3-Month Treasury Bill Index. Prior to May 1, 2021, the benchmark was the 3 Month LIBOR in USD Index. Historical benchmark representations have not been restated.
†The Value Added row is shown as Dynamic Credit (USD Hedged) Composite (Gross of Fees) minus the benchmark in the previous row.
‡The Value Added row is shown as Dynamic Credit (USD Hedged) Composite (Net of Fees) minus the benchmark in the previous row.
§Since Inception January 31, 2019 through December 31, 2019.
GIPS® Composite Report
Dynamic Credit (USD Hedged) Composite
Period ended December 31, 2023
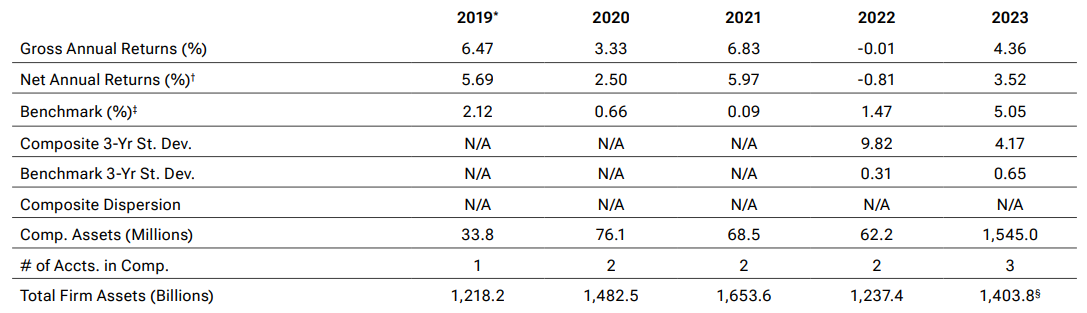
Figures shown in U.S. dollars
The annual gross and net returns for the composite for 2022 were previously presented as 0.24% and -0.57%. The returns have been updated to -0.01% and -0.81%, respectively.
*January 31, 2019, through December 31, 2019.
†The fee rate used to calculate net returns is 0.81%. This represents the maximum fee rate applicable to all composite members. Past performance is not a reliable indicator of future performance.
‡Effective May 1, 2021, the benchmark for the composite changed to the ICE BofA US 3-Month Treasury Bill Index. Prior to this change, the benchmark was the 3 Month LIBOR in USD Index. The change was made because the firm viewed the new benchmark to be a better representation of the investment strategy of the composite. Historical benchmark representations have not been restated.
§Preliminary - subject to adjustment.
T. Rowe Price (TRP) claims compliance with the Global Investment Performance Standards (GIPS®) and has prepared and presented this report in compliance with the GIPS standards. TRP has been independently verified for the 27-year period ended June 30, 2023, by KPMG LLP. The verification report is available upon request. A firm that claims compliance with the GIPS standards must establish policies and procedures for complying with all the applicable requirements of the GIPS standards. Verification provides assurance on whether the firm’s policies and procedures related to composite and pooled fund maintenance, as well as the calculation, presentation, and distribution of performance, have been designed in compliance with the GIPS standards and have been implemented on a firmwide basis. Verification does not ensure the accuracy of any specific composite presentation. TRP is a U.S. investment management firm with various investment advisers registered with the U.S. Securities and Exchange Commission, the UK Financial Conduct Authority, and other regulatory bodies in various countries and holds itself out as such to potential clients for GIPS purposes. TRP further defines itself under GIPS as a discretionary investment manager providing services primarily to institutional clients with regard to various mandates, which include U.S., international, and global strategies but excluding the services of the Private Asset Management group. As of October 1, 2022, there is no minimum asset level for portfolio inclusion into the composite. Prior to October 2022, the minimum asset level for equity portfolios to be included in composites was $5 million. The minimum asset level for fixed income and asset allocation portfolios to be included in composites was $10 million. Valuations are computed and performance reported in U.S. dollars. Gross performance returns are presented before management and all other fees, where applicable, but after trading expenses. Net-of-fees performance reflects the deduction of the maximum fee rate applicable to all composite members as shown above. Gross performance returns reflect the reinvestment of dividends and are net of non-reclaimable withholding taxes on dividends, interest income, and capital gains. Gross performance returns are used to calculate presented risk measures. Effective June 30, 2013, portfolio valuation and assets under management are calculated based on the closing price of the security in its respective market. Previously, portfolios holding international securities may have been adjusted for after-market events. Policies for valuing portfolios, calculating performance, and preparing compliant presentations are available upon request. Dispersion is measured by the standard deviation across asset-weighted portfolio returns represented within a composite for the full year. Dispersion is not calculated for the composites in which there are five or fewer portfolios. The strategy utilizes on a regular basis a variety of derivative instruments such as (but not limited to) currency forwards, fixed income futures, interest rate swaps, credit default swaps, synthetic indices, and options on all mentioned instruments, primarily to hedge certain market risks associated with the strategy’s objective, to express directional opportunities on specific markets, and to facilitate liquidity management. Benchmarks are taken from published sources and may have different calculation methodologies, pricing times, and foreign exchange sources from the composite. Composite policy requires the temporary removal of any portfolio incurring a client-initiated significant cash inflow or outflow greater than or equal to 15% of portfolio assets. The temporary removal of such an account occurs at the beginning of the measurement period in which the significant cash flow occurs and the account reenters the composite on the last day of the current month after the cash flow. Additional information regarding the treatment of significant cash flows is available upon request. The firm’s list of composite descriptions, a list of limited distribution pooled fund descriptions, and a list of broad distribution pooled funds are available upon request. GIPS® is a registered trademark of CFA Institute. CFA Institute does not endorse or promote this organization, nor does it warrant the accuracy or quality of the content contained herein.
Fee schedule
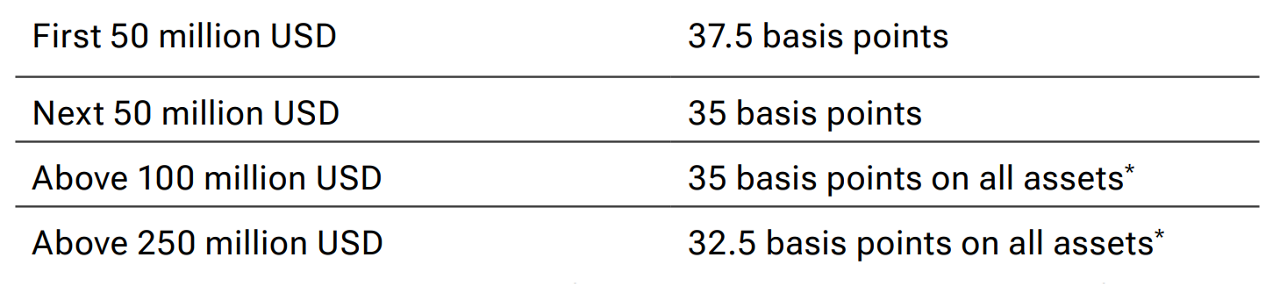
*A transitional credit is applied to the fee schedule as assets approach or fall below the breakpoint. Extended breakpoints may be available for higher asset levels.
Minimum separate account size 100 million USD.
Dynamic Credit (USD Hedged) Composite: The Dynamic Credit (USD Hedged) Composite seeks total return through a combination of income and capital appreciation, while defensively preserving capital throughout the credit cycle. The investment approach provides the flexibility to invest across a wide variety of global credit instruments without constraints to particular benchmarks, asset classes, or sectors. The strategy may invest in corporate and sovereign bonds, leveraged loans, municipal securities, securitized instruments, and derivative instruments that are linked to, or provide investment exposure to, equity or credit instruments. (Created January 2019; incepted January 31, 2019.)
Risks - The following risks are materially relevant to the portfolio:
ABS and MBS - Asset-backed securities (ABS) and mortgage-backed securities (MBS) may be subject to greater liquidity, credit, default, and interest rate risk compared with other bonds. They are often exposed to extension and prepayment risk.
China Interbank Bond Market - The China Interbank Bond Market may subject the portfolio to additional liquidity, volatility, regulatory, settlement procedure, and counterparty risks. The portfolio may incur significant trading and realization costs.
Contingent convertible bond - Contingent convertible bonds may be subject to additional risks linked to: capital structure inversion, trigger levels, coupon cancellations, call extensions, yield/valuation, conversions, write-downs, industry concentration, and liquidity, among others.
Country (China) - Chinese investments may be subject to higher levels of risks—such as liquidity, currency, regulatory, and legal risks—due to the structure of the local market.
Country (Russia and Ukraine) - Russian and Ukrainian investments may be subject to higher risks associated with custody and counterparties, liquidity, market disruptions, as well as strong or sudden political risks.
Credit - Credit risk arises when an issuer's financial health deteriorates and/or it fails to fulfill its financial obligations to the portfolio.
Currency - Currency exchange rate movements could reduce investment gains or increase investment losses.
Default - Default risk may occur if the issuers of certain bonds become unable or unwilling to make payments on their bonds.
Derivative - Derivatives may be used to create leverage that could expose the portfolio to higher volatility and/or losses that are significantly greater than the cost of the derivative.
Distressed or defaulted debt - Distressed or defaulted debt securities may bear a substantially higher degree of risks linked to recovery, liquidity, and valuation.
Emerging markets - Emerging markets are less established than developed markets and therefore involve higher risks.
Frontier markets - Frontier markets are less mature than emerging markets and typically have higher risks, including limited investability and liquidity.
High yield bond - High yield debt securities are generally subject to greater risk of issuer debt restructuring or default, higher liquidity risk, and greater sensitivity to market conditions.
Interest rate - Interest rate risk is the potential for losses in fixed income investments as a result of unexpected changes in interest rates.
Issuer concentration - Issuer concentration risk may result in performance being more strongly affected by any business, industry, economic, financial, or market conditions affecting those issuers in which the portfolio's assets are concentrated.
Liquidity - Liquidity risk may result in securities becoming hard to value or trade within a desired time frame at a fair price.
Prepayment and extension - Mortgage- and asset-backed securities could increase the portfolio's sensitivity to unexpected changes in interest rates.
Sector concentration - Sector concentration risk may result in performance being more strongly affected by any business, industry, economic, financial, or market conditions affecting a particular sector in which the portfolio's assets are concentrated.
Total return swap - Total return swap contracts may expose the portfolio to additional risks, including market, counterparty, and operational risks as well as risks linked to the use of collateral arrangements.
General portfolio risks:
Counterparty - Counterparty risk may materialize if an entity with which the portfolio does business becomes unwilling or unable to meet its obligations to the portfolio.
ESG and sustainability - ESG and sustainability risk may result in a material negative impact on the value of an investment and performance of the portfolio.
Geographic concentration - Geographic concentration risk may result in performance being more strongly affected by any social, political, economic, environmental, or market conditions affecting those countries or regions in which the portfolio's assets are concentrated.
Hedging - Hedging measures involve costs and may work imperfectly, may not be feasible at times, or may fail completely.
Investment portfolio – Investing in portfolios involves certain risks an investor would not face if investing in markets directly.
Management - Management risk may result in potential conflicts of interest relating to the obligations of the investment manager.
Market - Market risk may subject the portfolio to experience losses caused by unexpected changes in a wide variety of factors.
Operational - Operational risk may cause losses as a result of incidents caused by people, systems, and/or processes.
Representative Portfolio additional information:
The representative portfolio is an account in the composite we believe most closely reflects the current portfolio management style for the strategy.
Performance is not a consideration in the selection of the representative portfolio. The characteristics of the representative portfolio shown may differ from those of other accounts in the strategy.
Additional Disclosures
CFA® and Chartered Financial Analyst® are registered trademarks owned by CFA Institute.
Information has been obtained from sources believed to be reliable, but J.P. Morgan does not warrant its completeness or accuracy. The index is used with permission. The Index may not be copied, used, or distributed without J.P. Morgan’s prior written approval. Copyright © 2024, J.P. Morgan Chase & Co. All rights reserved.
“Bloomberg®” and the Bloomberg Indices are service marks of Bloomberg Finance L.P. and its affiliates, including Bloomberg Index Services Limited (“BISL”), the administrator of the index (collectively, “Bloomberg”) and have been licensed for use for certain purposes by T. Rowe Price. Bloomberg is not affiliated with T. Rowe Price, and Bloomberg does not approve, endorse, review, or recommend this Product. Bloomberg does not guarantee the timeliness, accurateness, or completeness of any data or information relating to this product.
ICE Data Indices, LLC (“ICE DATA”), is used with permission. ICE DATA, ITS AFFILIATES AND THEIR RESPECTIVE THIRD-PARTY SUPPLIERS DISCLAIM ANY AND ALL WARRANTIES AND REPRESENTATIONS, EXPRESS AND/OR IMPLIED, INCLUDING ANY WARRANTIES OF MERCHANTABILITY OR FITNESS FOR A PARTICULAR PURPOSE OR USE, INCLUDING THE INDICES, INDEX DATA AND ANY DATA INCLUDED IN, RELATED TO, OR DERIVED THEREFROM. NEITHER ICE DATA, ITS AFFILIATES NOR THEIR RESPECTIVE THIRD-PARTY SUPPLIERS SHALL BE SUBJECT TO ANY DAMAGES OR LIABILITY WITH RESPECT TO THE ADEQUACY, ACCURACY, TIMELINESS OR COMPLETENESS OF THE INDICES OR THE INDEX DATA OR ANY COMPONENT THEREOF, AND THE INDICES AND INDEX DATA AND ALL COMPONENTS THEREOF ARE PROVIDED ON AN “AS IS” BASIS AND YOUR USE IS AT YOUR OWN RISK. ICE DATA, ITS AFFILIATES AND THEIR RESPECTIVE THIRD-PARTY SUPPLIERS DO NOT SPONSOR, ENDORSE, OR RECOMMEND T. ROWE PRICE OR ANY OF ITS PRODUCTS OR SERVICES.
IMPORTANT INFORMATION
This material is being furnished for general informational and/or marketing purposes only. The material does not constitute or undertake to give advice of any nature, including fiduciary investment advice, nor is it intended to serve as the primary basis for an investment decision. Prospective investors are recommended to seek independent legal, financial and tax advice before making any investment decision. T. Rowe Price group of companies including T. Rowe Price Associates, Inc. and/or its affiliates receive revenue from T. Rowe Price investment products and services. Past performance is not a reliable indicator of future performance. The value of an investment and any income from it can go down as well as up. Investors may get back less than the amount invested.
The material does not constitute a distribution, an offer, an invitation, a personal or general recommendation or solicitation to sell or buy any securities in any jurisdiction or to conduct any particular investment activity. The material has not been reviewed by any regulatory authority in any jurisdiction.
Information and opinions presented have been obtained or derived from sources believed to be reliable and current; however, we cannot guarantee the sources’ accuracy or completeness. There is no guarantee that any forecasts made will come to pass. The views contained herein are as of the date noted on the material and are subject to change without notice; these views may differ from those of other T. Rowe Price group companies and/or associates. Under no circumstances should the material, in whole or in part, be copied or redistributed without consent from T. Rowe Price.
The material is not intended for use by persons in jurisdictions which prohibit or restrict the distribution of the material and in certain countries the material is provided upon specific request. It is not intended for distribution to retail investors in any jurisdiction.

Saurabh Sud is a portfolio manager in the Global Fixed Income Division. He manages the Dynamic Credit Strategy, co-manages the US Core Bond Strategy, and is a member of the Global Fixed Income Investment team, with a specific expertise in credit markets. Saurabh is an executive vice president of the International Funds, Inc.; chairman of the Investment Advisory Committee for the Dynamic Credit Fund; and a vice president and Investment Advisory Committee member of the Global Multi-Sector Bond and Total Return Funds. He also is a member of the Sector Strategy Advisory Group. Saurabh is a vice president of T. Rowe Price Group, Inc., and T. Rowe Price Associates, Inc.