February 2024 / INVESTMENT INSIGHTS
Could energy productivity cycles lead to credit opportunities
Why we believe the energy productivity cycle is turning and the opportunities this could create
Key Insights
- We see signs that productivity in the energy sector is waning, which could lead to a bull market for commodities that is more secular in nature.
- Oil and gas bull markets are generally supportive of energy sector credits relative to the broader market, but there is typically performance differentiation among energy subsectors.
- We currently see opportunities in select oil field services issuers as well as independent exploration and production companies.
Unprecedented productivity gains associated with the U.S. shale revolution drove a nearly decade-long bear market in oil and natural gas prices. However, there are growing signs that the bear market could be subsiding. Such a transition to falling productivity would likely create a more supportive environment for energy investing.
Distinguishing features of commodities supercycles
Like stocks and bonds, commodities tend to trade in cycles. But commodities cycles differ from equity cycles in several ways. Prices of commodities, including oil, gas, metals, and even food, tend to move together as opposed to the more disparate equity market. Because of the substantial costs and lengthy timelines associated with commodities projects, bull and bear market cycles tend to be longer than equity market cycles, leading to the term “supercycles.”
What drives price changes in commodities markets?
Prices of commodities, including energy, fluctuate for a variety of reasons. Some short-term factors that can influence energy prices include geopolitics, weather conditions, and the health of the global economy. While these near-term factors can certainly result in notable changes in energy prices, our fundamental approach to investing focuses heavily on structural factors that can drive prices over the long term, such as changes in productivity.
Oil productivity cycle
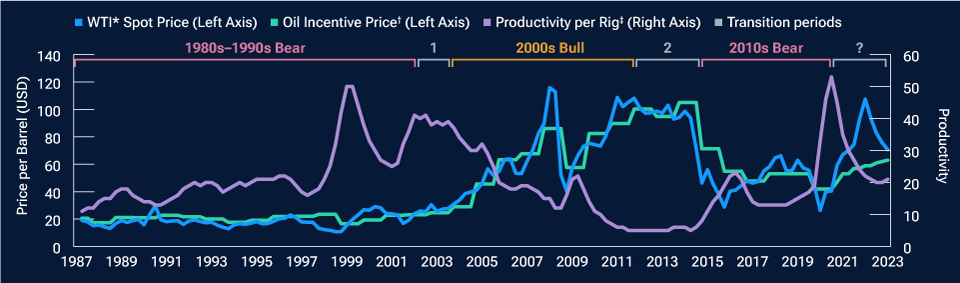
(Fig. 1) Changes in oil prices followed changes in productivity.
Past performance is not a reliable indicator of future performance.
Q3 1987–Q3 2023.
Sources: Bloomberg Finance L.P., Enverus, T. Rowe Price analysis.
*West Texas Intermediate (WTI)
†Productivity per Rig is US oil production in barrels divided by Baker Hughes Oil Rig Count to estimate amount of oil per rig in operation.
The role of productivity
Rising productivity from technological innovations enables oil and gas companies to extract more of a commodity out of the ground at a lower cost, which puts downward pressure on the industry’s prevailing break-even costs and the commodity prices needed to incentivize operators to pursue new projects. As a result, increasing productivity becomes a bearish setup for commodities.
Over time, the gains in commodity output unlocked by these innovations diminish as companies maximize the benefits of the technology and underlying assets mature. New resources become harder to find or more expensive to develop, pushing up prevailing break-even costs. This transition to falling productivity has tended to be a bullish setup for commodities prices.
The recent productivity cycle
The U.S. shale oil and gas revolution unleashed a surge in productivity and ushered in a bear market for oil and gas, but we see evidence that these productivity gains could be waning. There is typically a transition period when it is not yet clear which way the cycle could turn.
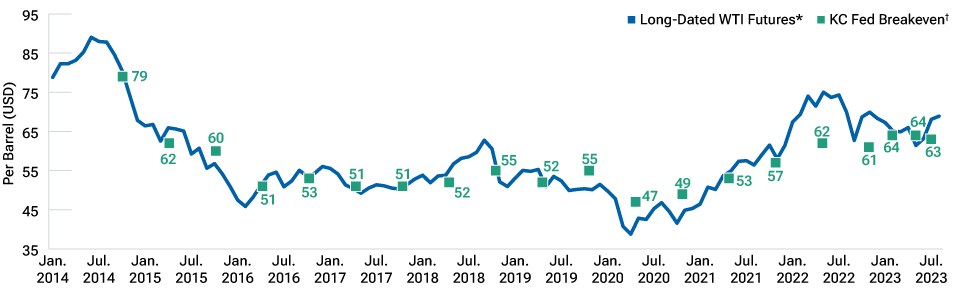
It is possible that as pandemic-related distortions normalize, what appeared to us as a structural change will end up being a cyclical dynamic. In that case, the market would return to reacceleration and productivity could pick up again, potentially putting downward pressure on oil prices. However, Figure 2 shows both market-based pricing (WTI futures) and producer surveys (Kansas City Federal Reserve (KC Fed) incentive price) exhibiting not only a recovery from pandemic distortions, but also an increase in the prices required to make a profit according to producers, which is likely driven by a slowdown in productivity in the U.S. as available oil and gas becomes more expensive to obtain. This dynamic leads us to believe that the commodities supercycle is turning.
Producer survey breakeven prices and market-based oil price expectations
(Fig. 2) Market-based pricing and producer survey indicate higher prices following recovery from pandemic.
Sources: Bloomberg Finance L.P., Federal Reserve Bank of Kansas City.
* WTI long-dated futures is represented by the three-year futures contract for WTI oil, a U.S. crude oil price assessment.
†The KC Fed asks energy firms in its district what oil price (WTI per barrel) was needed on average for drilling to be profitable.
- See our equity colleagues’ research highlighting factors increasing costs to obtain oil and gas: “Why the Environment for Energy Investing Is Improving.”
Look for dispersion in a bull market
In this scenario, we see potential for energy credits to outperform the overall U.S. investment-grade bond market (USIG). Consider recent bull and bear market energy cycles: In the bear market, energy credits, on average, traded with wider credit spreads1 than the broad U.S. investment-grade corporate bond market. In the bull market, energy credit spreads were tighter, on average, than the broad investment-grade corporate market.2 The higher oil prices present during the bull market appeared to support energy sector assets, leading to outperformance compared with the broader market.
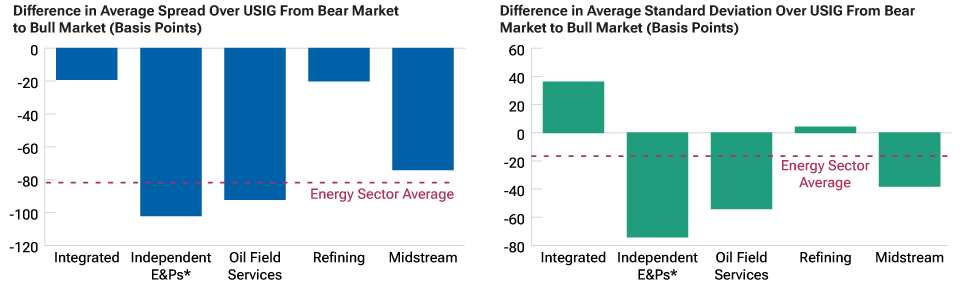
Bear market to bull market change in spread and standard deviation of spread between USIG and energy subsectors
(Fig. 3) Energy credit outperformance varied by subsector during energy bull market.
Past performance is not a reliable indicator of future performance.
As of September 30, 2023.
Sources: Bloomberg Corporate Index; T. Rowe Price analysis.
*Independent exploration and production
Energy subsector classifications as determined by the Bloomberg Industry Classification System. Average spread is the average of monthly spread over the stated periods: Bear market (9/30/2014–12/31/2020) and bull market (6/30/2003–6/30/2012) troughs in oil prices (the quarter in which the trough occurred) represent the beginning of bull markets, while peaks (the quarter in which the peak occurred) represent the end of the bull and beginning of bear markets.
Standard deviation measures historical volatility. It is a measure of the amount of variation or dispersion of a set of values. A low standard deviation indicates that the values tend to be close to the mean of the set, while a high standard deviation indicates that the values are spread out over a wider range, implying greater volatility.
Energy credits also displayed reduced volatility during the recent energy bull market. During this period, yield changes in energy sector credits were less pronounced when compared to the broader U.S. investment-grade market.
Figure 3 illustrates that, while the broader energy market outperformed and was less volatile during the most recent bull market, energy subsectors participated to different degrees. The independent E&P and oil field services subsectors displayed the greatest performance differences in the recent bull and bear markets, which makes intuitive sense—they are the most sensitive to oil prices. We believe that the impact of a productivity cycle transition on sectors further down the value chain would be mixed.
Where do we see opportunities?
The setup for a bullish cycle is evident, prompting us to consider adding to positions featuring favorable fundamentals and relative value. Should the global economic environment become recessionary, pushing oil prices lower in the short term, we could add exposure to companies where we see improved relative value. The magnitude of differences between bull and bear markets is notable and highlights the importance of identifying a change in the energy cycle.
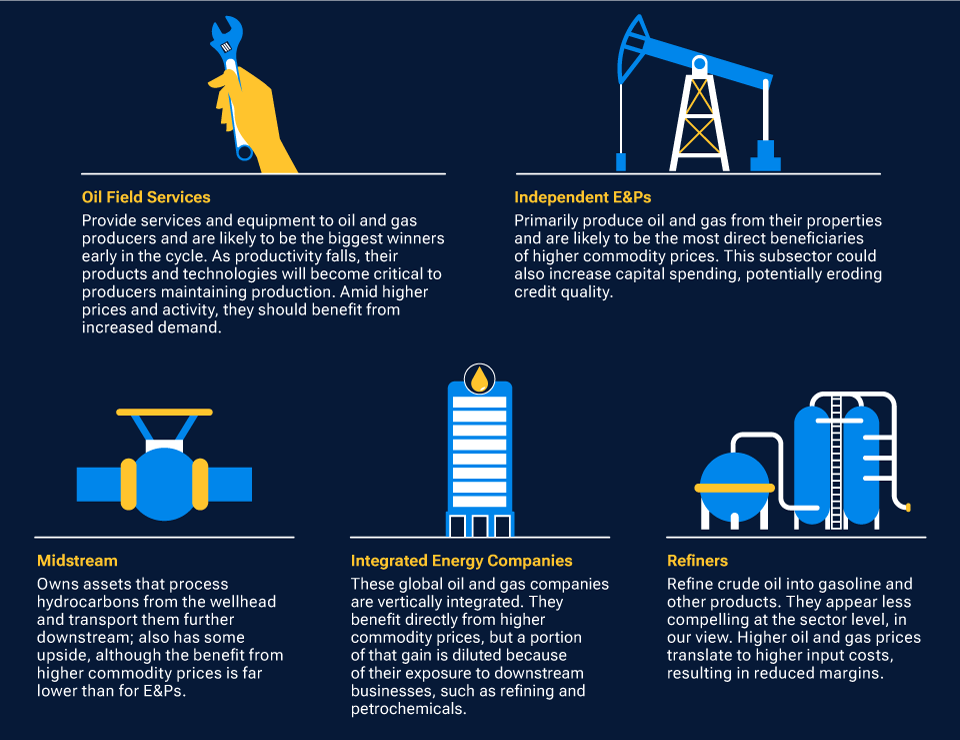
Where we see opportunities in energy subsectors
Additional Disclosure
CFA® and Chartered Financial Analyst® are registered trademarks owned by CFA Institute.
IMPORTANT INFORMATION
This material is being furnished for general informational and/or marketing purposes only. The material does not constitute or undertake to give advice of any nature, including fiduciary investment advice, nor is it intended to serve as the primary basis for an investment decision. Prospective investors are recommended to seek independent legal, financial and tax advice before making any investment decision. T. Rowe Price group of companies including T. Rowe Price Associates, Inc. and/or its affiliates receive revenue from T. Rowe Price investment products and services. Past performance is not a reliable indicator of future performance. The value of an investment and any income from it can go down as well as up. Investors may get back less than the amount invested.
The material does not constitute a distribution, an offer, an invitation, a personal or general recommendation or solicitation to sell or buy any securities in any jurisdiction or to conduct any particular investment activity. The material has not been reviewed by any regulatory authority in any jurisdiction.
Information and opinions presented have been obtained or derived from sources believed to be reliable and current; however, we cannot guarantee the sources’ accuracy or completeness. There is no guarantee that any forecasts made will come to pass. The views contained herein are as of the date noted on the material and are subject to change without notice; these views may differ from those of other T. Rowe Price group companies and/or associates. Under no circumstances should the material, in whole or in part, be copied or redistributed without consent from T. Rowe Price.
The material is not intended for use by persons in jurisdictions which prohibit or restrict the distribution of the material and in certain countries the material is provided upon specific request. It is not intended for distribution to retail investors in any jurisdiction.
Steve Booth is a vice president of T. Rowe Price Group, Inc., and is the general manager and head of Legal Shared Services in the Legal Department. In this capacity, Steve is responsible for ensuring the department is operating effectively through policy, administration, technology, and financial management. His responsibilities also include strategic oversight of investment compliance, code administration and regulatory filings, and global compliance communications and the Departmental Compliance, Risk, and Process Development Groups. Prior to his current position, Steve was a general manager within Investment Operations supporting the Equity Division. Before joining T. Rowe Price in 1997, Steve spent 13 years with Price Waterhouse (now PricewaterhouseCoopers) and was a director in the Investment Management Services Group. While there, he managed Price Waterhouse's relationship with T. Rowe Price and several other large investment management firms. He earned a B.S. in accounting from Western Michigan University and is a certified public accountant. Steve is also a Series 7 registered representative and Series 24 registered principal.

Elliot Shue is a corporate credit analyst in the Fixed Income Division. He is a member of the Investment Advisory Committee for the Corporate Income Fund and a member of the Money Market Credit Policy Committee. Elliot also is a vice president of T. Rowe Price Group, Inc., and T. Rowe Price Associates, Inc.