October 2023 / MULTI-ASSET INSIGHTS
The View from the Knife's Edge: A New Market Regime
A new market regime isn’t necessarily a reason to be bearish.
I’ll always remember when, at the beginning of my career, I interviewed for an internship at State Street. My most important interview was with Mark Kritzman, CEO of Windham Capital Management, partner of State Street Associates, and lecturer at the MIT Sloan School of Management.
My English was mediocre at best, and I didn’t come from a prestigious university. I had less than a year of cumulative internship experience. So, before the interview, I read all the research papers and books Mark had ever published.
The interview did not go well. There’s a long story as to how I got the internship, best told over a beer. More importantly, while I was preparing for the interview, I discovered a paper that would change how I think of risk management for the rest of my career. “Optimal Portfolios in Good Times and Bad”1 demonstrated that asset class volatilities and correlations are unstable. To address this issue, Mark and his co-authors estimated risk across two regimes: quiet and turbulent.
The statistical methods weren’t new, but the applications to risk measurement and portfolio construction were groundbreaking. Since then, a lot of papers have been published on similar applications. There are countless ways to parse historical data into regimes.
So a couple of weeks ago, when members of our Asset Allocation Committee asked whether we had entered a new market regime, the question seemed like the perfect nail for my regime hammer. Some Committee members even used the controversial word “stagflation.”
I asked my colleague, Gerard Brunick, a quantitative investment analyst in the Multi-Asset Division, to crunch the data.2 Our goal was to gauge whether recent conditions might resemble past market regimes.
Some Conclusions First
Here are my takeaways from the analysis:
- We are likely in a new market regime.
- Recent economic conditions do NOT look like the stagflation that occurred in the 1970s.
- We shouldn’t get too bearish because, historically, markets showed plenty of life when the fed funds rate was above 5%.
- Higher interest rates don’t necessarily take all the oxygen out of the system. The market could get excited by the prospect of productivity gains driven by artificial intelligence (AI).
My thoughts on what these takeaways could mean for how we invest appear in the final section.
Histories of Four Market Regimes
We kept the regime definitions simple and focused on four distinct eras, surveyed below. Each period runs from January 1 of the start year to December 31 of the ending year.
1. Postwar Boom (1955–1969)
Because of data limitations, our “postwar boom” starts in 1955—a decade after the end of World War II. But bear with me: The demobilization and the Korean War made the 1945-1953 period different from our 1955–1969 postwar boom. This era of prosperity had the strongest economic growth and the lowest unemployment of our four regimes. Inflation was also low, in the 2% range. Automation technologies, a broadening of the labor force (women, minority groups, immigrants), and globalization drove significant productivity gains.
2. Stagflation (1970–1981)
During Stagflation, inflation spikes due to supply shocks, even when demand is weak because of economic stagnation. This era featured major oil price shocks in 1973–1974 and 1978–1979. The recession of 1970 kicked off this market regime, which eventually ended after central bank Chair Paul Volker slayed the inflation dragon by taking the fed funds rate to as high as 20%. It wasn’t a happy time for the economy or markets. Inflation was high and often unanchored. Growth in gross domestic product (GDP) was low and unstable. Stock returns were the lowest of the four regimes.
3. Old Normal (1982–2007)
The steady decline in interest rates was the defining feature of this era, although they remained in positive territory and did not reach the zero bound. Economic growth and inflation were “normal,” at about 3% each. Capital markets outperformed the economy due to rising valuations and cheap leverage. Nevertheless, the business cycle continued, with bull markets and crashes.
4. New Normal (2008–2019)
After the global financial crisis, we entered an era of extremely accommodative central bank policy. In the new normal, the economy got stuck in neutral, with low rates, low growth, and low inflation.
In a 2009 article3, Mohamed El-Erian, who coined the term “New Normal” when he was at PIMCO, predicted “a world of muted growth.” He believed that policymakers’ response to the 2008 crisis would help to avoid another Great Depression but would not be “strong enough for a return to the high growth and low inflation that characterized 2002–07.”
Some of our equity portfolio managers think that cheap capital (zero interest rates) enabled the aggressive development of new technologies. “Zero rates created Tesla,” a colleague said. Low growth in the New Normal could explain the dominance of large growth companies that had generated strong cash flows in all kinds of economic environments, even without a cyclical upswing.
What Historical Market Regimes Rhyme With the Recent Environment?
Gerard used a statistical model to estimate the similarity of recent macroeconomic conditions to each of the four historical regimes (see appendix). We focused on the following variables:
1. Effective Fed Funds Rate
2. Inflation (annual, all items)
3. GDP Growth (annual, seasonally adjusted)
4. Unemployment (seasonally adjusted)
Each regime represents a distribution of quarterly outcomes. That means we’re dealing with probabilities or “similarities,” not certainties.
Step 1 in Our Similarity Contest
Let’s start with something you probably already know: The most recent Fed funds rate and inflation readings are closest to the old normal.
The X in the scatterplot below reflects the most recent Fed funds rate and inflation data. The green dots show the combinations of Fed funds and inflation for each of the quarters during the old normal, while the blue dots represent the new normal (notice all the dots that are stuck at the zero bound in the new normal). The ovals show a 90% confidence region for each regime.
Recent Macroeconomic Conditions Resemble the Old Normal
(Fig. 1) Fed Funds and Inflation: Old Normal vs. New Normal
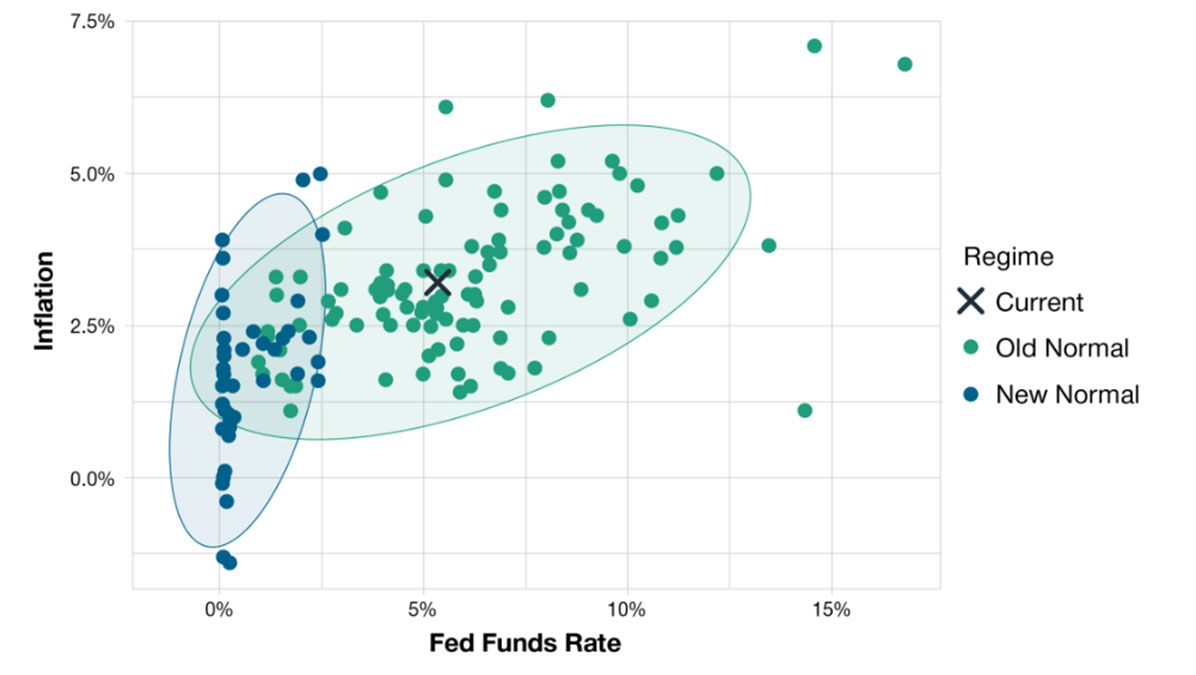
Source: Federal Reserve and Bureau of Labor Statistics/Haver Analytics. Data analysis by T. Rowe Price. Old Normal is January 1, 1982, to December 31, 2007. New Normal is January 1, 2008, to December 31, 2019. All historical regime data is quarterly. Fed Funds Rate is the Effective Fed Funds Rate. Most recent Fed Funds Rate is as of August 31, 2023. Inflation is the annual change in the Consumer Price Index and includes all items. Most recent Inflation data point is for July 2023.
Here’s a more interesting observation: Based on inflation and the Fed funds rate, the second-closest regime to recent conditions is not stagflation—it’s the postwar boom.
When we expand the model to include a third factor (GDP Growth) the current environment still looks closer to the old normal, even though the relatively low rate of economic expansion is more in line with new normal standards.
We also ran a model incorporating all four factors, which you can do mathematically. But you can’t visualize data in more than three dimensions, “at least not without consuming controlled substances,” someone once told me.
The Postwar Boom: A Surprising Runner-Up in the Similarity Contest
(Fig. 2) Fed Funds Rate and Inflation: Old Normal vs. Postwar Boom
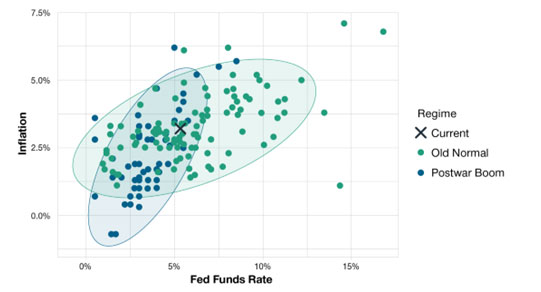
Source: Federal Reserve and Bureau of Labor Statistics/Haver Analytics. Data analysis by T. Rowe Price. Postwar Boom is January 1, 1955, to December 31, 1969. Old Normal is January 1, 1982, to December 31, 2007. All historical regime data is quarterly. Fed Funds Rate is the Effective Fed Funds Rate. Most recent Fed Funds Rate is as of August 31, 2023. Inflation is the annual change in the Consumer Price Index and includes all items. Most recent Inflation data point is for July 2023.
Adding a Third Factor: Recent Conditions Still Resemble the Old Normal
(Fig. 3) Fed Funds Rate, Inflation, and GDP Growth: Old Normal vs. New Normal
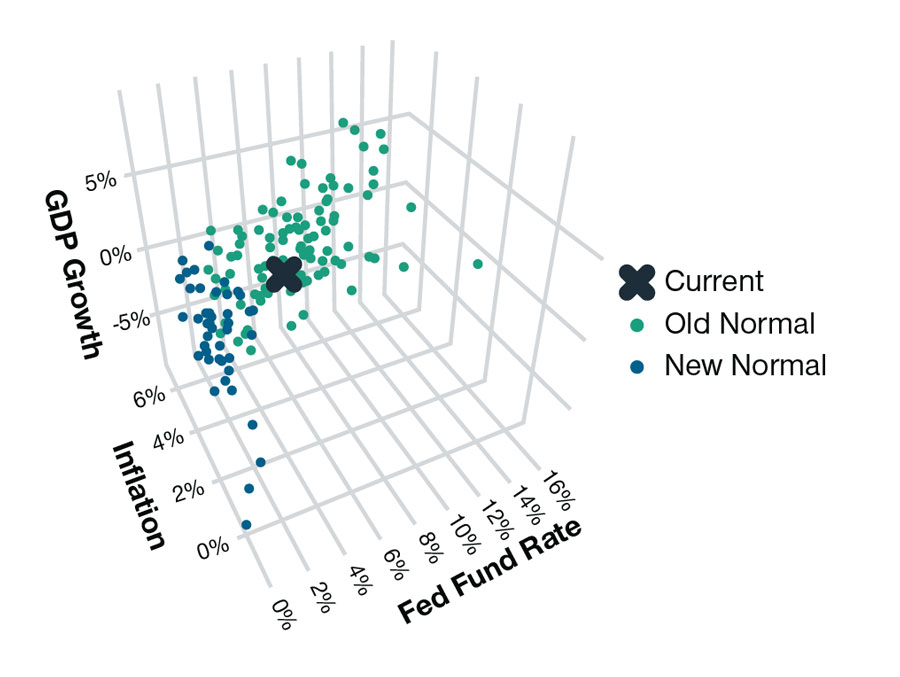
Source: Federal Reserve, Bureau of Labor Statistics, and Bureau of Economic Analysis/Haver Analytics.
Data analysis by T. Rowe Price. Old Normal is January 1, 1982, to December 31, 2007. New Normal is January 1, 2008, to December 31, 2019. All historical regime data is quarterly. Fed Funds Rate is the Effective Fed Funds Rate. Most recent Fed Funds Rate is as of August 31, 2023. Inflation is the annual change in the Consumer Price Index and includes all items. Most recent Inflation is for July 2023. GDP Growth is the seasonally adjusted, annual change in U.S. real GDP. The most recent GDP growth is for the second quarter of 2023.
Step 2 in Our Similarity Contest
Next, Gerard calculated the probability that recent macroeconomic conditions were generated from a given market regime. Our models account for interaction effects between the four variables.4 We also calculated the “multi-variate distance” between current conditions and each of the regimes.5
The three tables below show the results for three iterations of the model. They follow the same progression from two factors (fed funds rate and inflation), to three (fed funds rate, inflation, and GDP growth), and then all four. Detailed data for each regime are in the appendix.
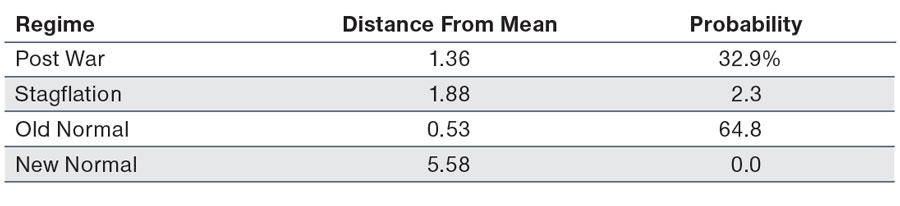
Two-Factor Model: Fed Funds Rate and Inflation
(Fig. 4) Market regime probabilities
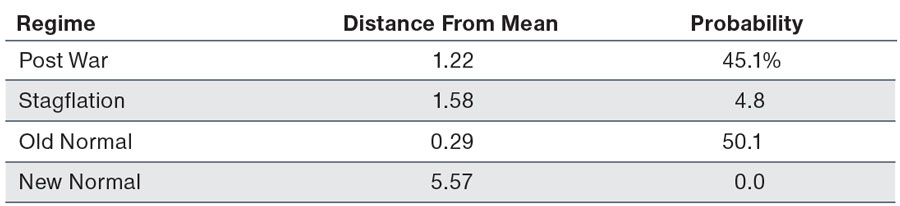
Source: Federal Reserve and Bureau of Labor Statistics/Haver Analytics. Data analysis by T. Rowe Price. See Methodology section for more details on these calculations.
Postwar Boom is January 1, 1955, to December 31, 1969. Stagflation is January 1, 1970, to December 31, 1981. Old Normal is January 1, 1982, to December 31, 2007. New Normal is January 1, 2008, to December 31, 2019. Fed Funds Rate is the Effective Fed Funds Rate. Inflation is the annual change in the Consumer Price Index and includes all items.
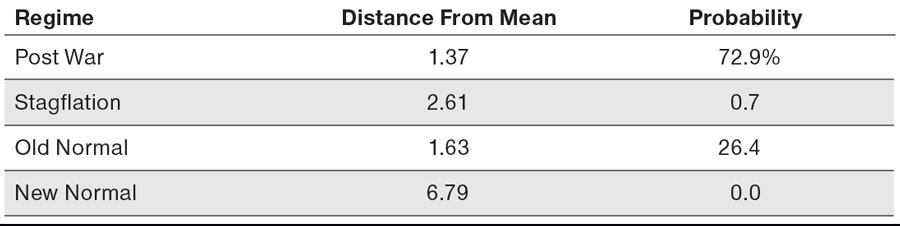
Three-Factor Model: Fed Funds Rate, Inflation, and GDP Growth
(Fig. 5) Market regime probabilities
Source: Federal Reserve, Bureau of Labor Statistics, and Bureau of Economic Analysis/Haver Analytics.
Data analysis by T. Rowe Price.
See Methodology section for more details on these calculations.
Postwar Boom is January 1, 1955, to December 31, 1969. Stagflation is January 1, 1970, toDecember 31, 1981. Old Normal is January 1, 1982, to December 31, 2007. New Normal is January 1, 2008, to December 31, 2019.
Fed Funds Rate is the Effective Fed Funds Rate. Inflation is the annual change in the Consumer PriceIndex and includes all items. GDP Growth is the seasonally adjusted, annual change in U.S. real GDP.
Four-Factor Model: Fed Funds Rate, Inflation, GDP Growth, and Unemployment
(Fig. 6) Market regime probabilities
Source: Federal Reserve, Bureau of Labor Statistics, and Bureau of Economic Analysis/Haver Analytics.
Data analysis by T. Rowe Price. See Methodology section for more details on these calculations.
Fed Funds Rate is the Effective Fed Funds Rate. Inflation is the annual change in the Consumer Price Index and includes all items. GDP Growth is the seasonally adjusted, annual change in U.S. real GDP. Unemployment is the seasonally adjusted U.S. civilian unemployment rate.
The most recent fed funds and inflation rate, taken together, most resemble the old normal or postwar boom data.
Adding GDP growth to the model gets us closer to the old normal. The postwar boom was characterized by stronger economic growth than the current environment.
The four-factor model includes unemployment, which was quite low as of August 2023. That gets us closer, again, to the postwar boom.
My View From the Knife’s Edge
Given the post-pandemic distortions in macro data, I believe there’s a possibility that the market could shift into something resembling any of these four historical regimes over the next few months.
That said, a return to the new normal strikes me as the least likely outcome. The new normal is old news. Stagflation also appears less likely.
This chart shows the sensitivity of regime probabilities to our assumption about inflation, using the three-factor model (Fed funds rate, inflation, and GDP growth).
The vertical bar shows, again, that the regime probabilities for current conditions are split between old normal (green line) and postwar boom (red line). However, should inflation reaccelerate above 6%, and growth remain anemic, the stagflation probability (purple line) would jump to 75% or higher.
What Would Increase the Risk of Stagflation in Our Three-Factor Model?
(Fig. 7) Regime probabilities vs inflation
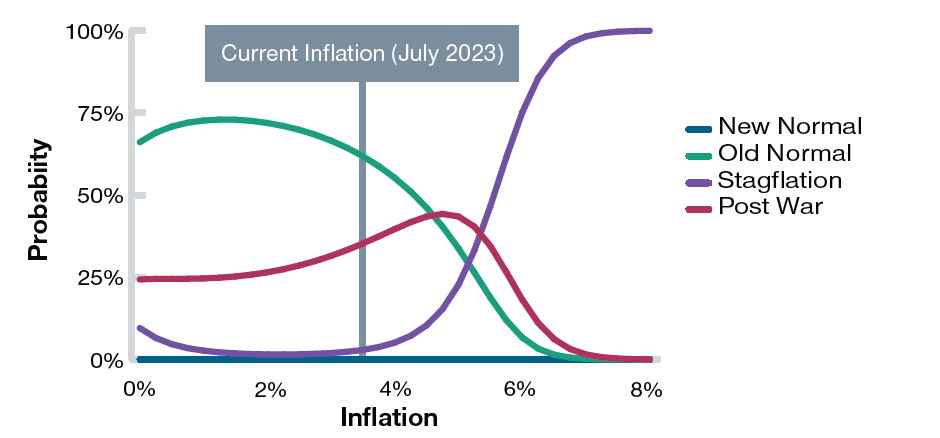
Source: Federal Reserve, Bureau of Labor Statistics, and Bureau of Economic Analysis/Haver Analytics.
Data analysis by T. Rowe Price. The chart depicts the probability that a hypothetical data point with thecurrent Fed Funds rate (as of August 31, 2023), current GDP Growth (second quarter of 2023), and an inflation rate in the range displayed on the X-axis would have come from each historical regime.
Stock and Bond Market Returns by Historical Regime
(Fig. 8) Average annual total returns
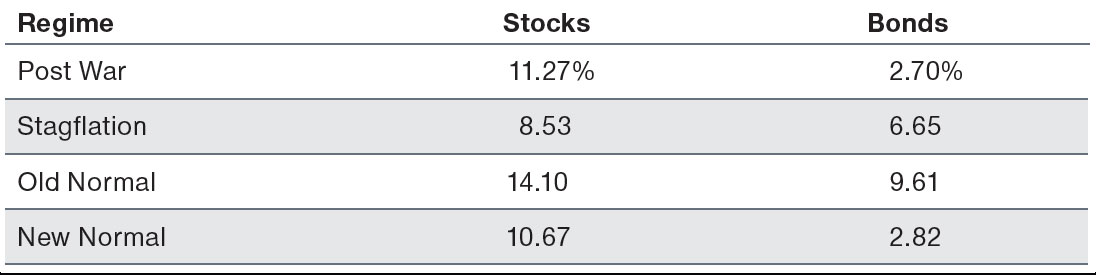
Past performance is not a reliable indicator of future performance.
Source: Bloomberg Finance L.P., Morningstar Direct, and S&P Indices. Data analysis by T. Rowe Price. Postwar Boom is January 1, 1955, to December 31, 1969. Stagflation is January 1, 1970, to December 31, 1981. Old Normal is January 1, 1982, to December 31, 2007. New Normal is January 1, 2008, to December 31, 2019. Stock total returns are for the S&P 500 Index. Bond total returns are for the Ibbotson Intermediate (5-Year) Government Bonds Index for 1955 to 1975 and the Bloomberg US Aggregate Bond Index for 1976 through 2019.
The Asset Allocation Committee believes that inflation risk skews to the upside. Rising energy prices are a concern amid emerging pressures on the supply side of the market. Labor costs may also head higher, a point underscored by the United Auto Workers strike.
My Takeaway: High rates won’t kill the economy. Rates are high relative to the new normal, but not relative to the history of capital markets. The Fed Funds Rate has exceeded 5% for decades, and stock markets still did well. And, as one Asset Allocation Committee member pointed out, “Sticky inflation historically has been good for earnings.”
Some Caveats
The high level of U.S. government debt is an important caveat. On the other hand, consumer and corporate leverage looks low relative to historical standards.
Also, Committee members pushed back that the high equity returns of the Postwar Boom and Old Normal regimes benefited from favorable starting points.
The postwar boom started with significant slack in the economy, creating lots of room for productivity gains. And the old normal started with extremely high interest rates, which set the stage for the multi-decade decline in interest rates—the mother of all valuation tailwinds.
My Investment Conclusions
The world is different now. We’re in a NEW regime, an environment that will look different from the four we studied. Nonetheless, history often rhymes.
Let’s not get too bearish. Market segments that don’t trade at nosebleed valuations, such as small- and mid-cap stocks and real asset equities, look appealing on a relative basis. And if we see a spike in volatility and a market sell-off, it may be an opportunity to buy stocks.
IMPORTANT INFORMATION
This material is being furnished for general informational and/or marketing purposes only. The material does not constitute or undertake to give advice of any nature, including fiduciary investment advice, nor is it intended to serve as the primary basis for an investment decision. Prospective investors are recommended to seek independent legal, financial and tax advice before making any investment decision. T. Rowe Price group of companies including T. Rowe Price Associates, Inc. and/or its affiliates receive revenue from T. Rowe Price investment products and services. Past performance is not a reliable indicator of future performance. The value of an investment and any income from it can go down as well as up. Investors may get back less than the amount invested.
The material does not constitute a distribution, an offer, an invitation, a personal or general recommendation or solicitation to sell or buy any securities in any jurisdiction or to conduct any particular investment activity. The material has not been reviewed by any regulatory authority in any jurisdiction.
Information and opinions presented have been obtained or derived from sources believed to be reliable and current; however, we cannot guarantee the sources’ accuracy or completeness. There is no guarantee that any forecasts made will come to pass. The views contained herein are as of the date noted on the material and are subject to change without notice; these views may differ from those of other T. Rowe Price group companies and/or associates. Under no circumstances should the material, in whole or in part, be copied or redistributed without consent from T. Rowe Price.
The material is not intended for use by persons in jurisdictions which prohibit or restrict the distribution of the material and in certain countries the material is provided upon specific request. It is not intended for distribution to retail investors in any jurisdiction.

Sébastien Page is head of Global Multi-Asset and chief investment officer. He is a member of the Asset Allocation Committee, which is responsible for tactical investment decisions across asset allocation portfolios. Sébastien also is a member of the Management Committee of T. Rowe Price Group, Inc.