August 2023 / MULTI-ASSET
Keep Long and Carry On
High yield bonds paired with long-term Treasuries offer attractive carry.
In retrospect, the “magic barbell” was one of the best things about the good old days of the four‑decade bull market in bonds. (For those not familiar, a barbell allocation is one that is tilted toward two offsetting extremes and away from the middle. In fixed income terms, this might be a portfolio that is concentrated in both short‑term and long‑term bonds, high‑rated and low‑rated issues, etc.)
Before the bond bull market ended in 2022, assembling an efficient fixed income portfolio was relatively simple: Hang a long credit position on one side of a barbell allocation and then place a long duration bet in the form of U.S. Treasuries on the other. Should the economy slow, the credit side of the barbell would suffer some, but yields would also go down, boosting Treasury prices.
The good old days of carry
The magic barbell works especially well when rates are high enough so that you also earn carry on your Treasuries. I’m loosely defining carry here as the extra income or yield that you earn for holding a risky asset assuming conditions don’t change. High yield bonds have higher coupons and offer more “carry” than Treasuries, for example.
You can see how that situation makes life easier for professional active bond investors. They overweight credit, overweight duration, and go play golf. Unfortunately, that doesn’t work so well when rates are near zero and the economy is slowing.
The good news: After a long period of zero interest rates, we’re back in a favorable Treasury carry environment. Bring back the magic barbell.
Clients have been asking me why our Asset Allocation Committee is underweight core investment‑grade bonds, since the equity risk premium is compressed. Part of the answer is that we’re substituting core bonds for the magic barbell. We’re overweighting credit (high yield, emerging markets bonds, and loan), and long Treasuries.
Long Treasuries? Yes, yes, I know. The yield curve is inverted. We’re also long cash, which has the potential to earn more carry than long Treasuries. But let’s remember that long Treasuries typically give more bang for the buck during a recession shock; we consider them a better “hedge”. In Q4 2008, for example, cash was essentially flat, while long Treasuries were up 19%.1
Why high yield?
“But isn’t high yield expensive?” some might ask. (And, believe me, they have.) Recently, I turned to my colleagues Paul Massaro, head of Global High Yield; Grace Zheng, quantitative investment analyst; David Eiswert, Asset Allocation Committee cochair and portfolio manager; and Charles Shriver, Asset Allocation Committee cochair and portfolio manager to help explain why valuations in the sector are more attractive than you might think.
Looking at high yield through a different lens
It’s true that global high yield spreads—the extra yield potential they offer over U.S. Treasuries with similar maturities—are in their 38th percentile based on data going back to 2004. This means that high yield bond spreads have been tighter (or more expensive) only 38% of the time over the last two decades. Not terrible, but hardly a screaming deal.2
However, there are many ways to calculate valuation percentiles, especially now that rates are higher, the yield curve is inverted, and equity valuations look frothy. High yield looks attractive through these alternative lenses, which offer context on the sector’s valuation (recall that the higher the percentage, the better the valuation appeal):
- Lens 1: Duration Advantage. High yield bonds generally have shorter duration than core bonds. When measured relative to 10‑year Treasury bond, high yield spreads are in their 65th percentile. And relative to core IG bonds (as measured by the Barclays US Aggregate Index), they’re in their 52nd percentile.3 These percentiles are higher than for duration‑matched spreads because the yield curve is inverted. In other words, this lens gives “credit” to high yield for its shorter duration.
- Lens 2: Comparison With Earnings Yield. High yield bonds look cheap relative to stocks. The earnings yield on stocks of about 5% pales in comparison with the 9% offered by global high yield (as of July 19, 2023). The difference between the yield on high yield bonds and the earnings yield for the Russell 3000 Index is in its 90th percentile—thanks in part to a high risk‑free rate environment.4
- Lens 3: Quality. The quality of the high yield asset class is better than it used to be. As shown in the chart below, since 2007, lower‑quality B rated and below bonds have dropped 62% to 40% of the index, while higher‑quality BB bonds have increased from 33% to 56%. Hence, on a quality‑adjusted basis, high yield spreads are wider than they first appear.
While the improved quality of the high yield sector is slowly being reflected in the market, the order of magnitude of its improvement does not seem to be fully appreciated.
Another way to look through the quality lens is to estimate “default‑adjusted yields,” which I’m defining here as the difference between yield and default rates. I’m putting this term in quotes because yields are forward‑looking, while defaults are measured after the fact, usually on a trailing 12‑month basis. When defaults are expected to rise, as in the current environment, spreads will look a bit too attractive relative to trailing defaults.5
Changes in High Yield Index Composition
(Fig. 1) Share of bonds by rating
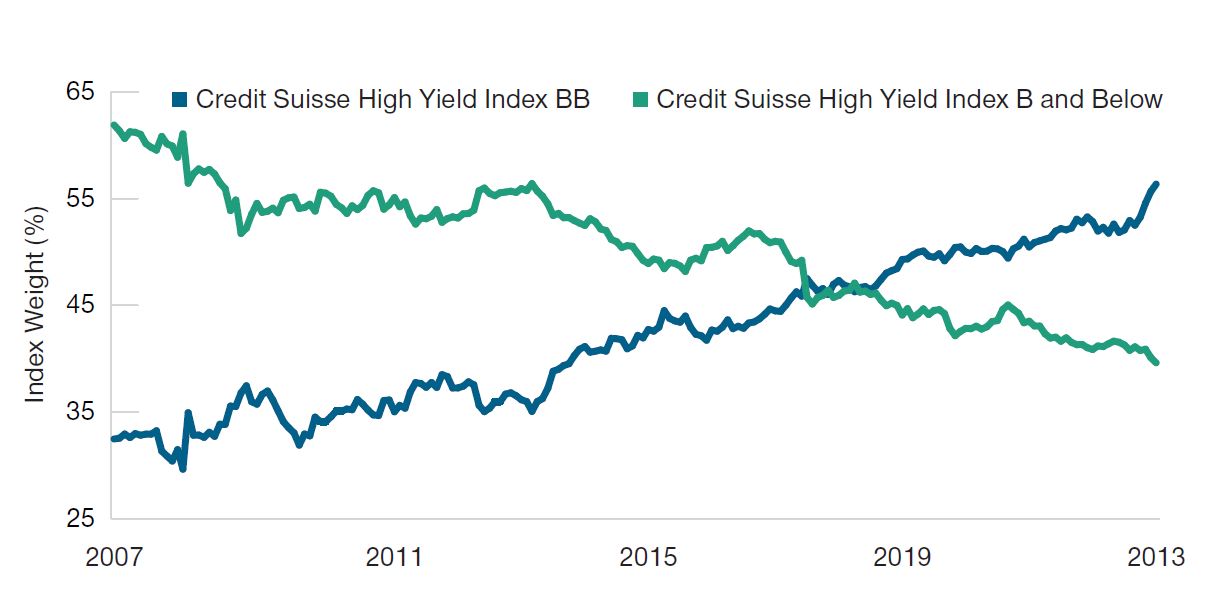
January 2007 to June 2023.
Source: Credit Suisse. Please see References for more information about this sourcing information.
Nonetheless, the chart below shows that this lens puts high yield’s default‑adjusted yield in its 83rd percentile. That may turn out to be an inflated number if we get a hard landing. But our credit research team expects high yield defaults over the next 12 months to merely normalize close to historical averages. And our research shows that high yield tends to outperform stocks when this measure is in its top quintile.
Default-Adjusted Yields
(Fig. 2) Yield to worst* less the default rate
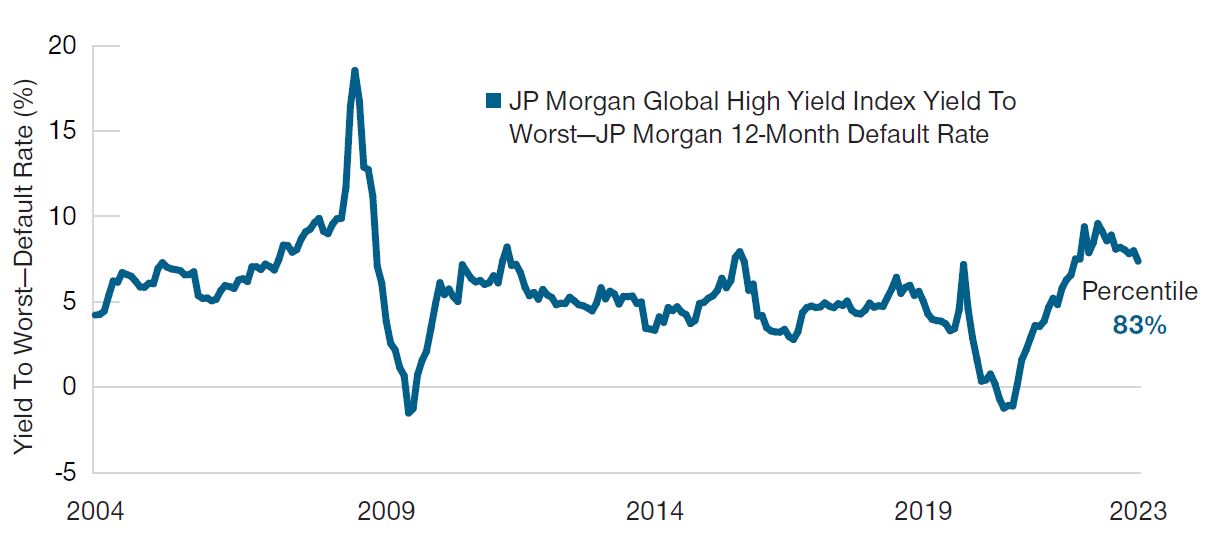
January 2004 to June 2023.
*The lowest possible yield a bondholder will receive on a callable bond absent
default.
Sources: Bloomberg Finance, L.P., and J.P. Morgan Chase & Co. Please see References for more information about this sourcing information.
Stay long stocks for the long run
Before you sell all your stocks and buy high yield bonds, I need to clarify that we still like stocks for the long run. We always do. Historically, stocks have compensated investors for the additional risk of being lower on the capital structure than bonds. Tactically, we’re only slightly underweight stocks.
My takeaway is rather that, for the next six to 18 months, high yield looks more attractive as an asset class than stocks, even if high yield spreads have compressed and growth is slowing. Moreover, in a world where duration can play its traditional role of diversifier to spread risk, we are overweight high yield as part of the magic barbell with long Treasuries.
IMPORTANT INFORMATION
This material is being furnished for general informational and/or marketing purposes only. The material does not constitute or undertake to give advice of any nature, including fiduciary investment advice, nor is it intended to serve as the primary basis for an investment decision. Prospective investors are recommended to seek independent legal, financial and tax advice before making any investment decision. T. Rowe Price group of companies including T. Rowe Price Associates, Inc. and/or its affiliates receive revenue from T. Rowe Price investment products and services. Past performance is not a reliable indicator of future performance. The value of an investment and any income from it can go down as well as up. Investors may get back less than the amount invested.
The material does not constitute a distribution, an offer, an invitation, a personal or general recommendation or solicitation to sell or buy any securities in any jurisdiction or to conduct any particular investment activity. The material has not been reviewed by any regulatory authority in any jurisdiction.
Information and opinions presented have been obtained or derived from sources believed to be reliable and current; however, we cannot guarantee the sources’ accuracy or completeness. There is no guarantee that any forecasts made will come to pass. The views contained herein are as of the date noted on the material and are subject to change without notice; these views may differ from those of other T. Rowe Price group companies and/or associates. Under no circumstances should the material, in whole or in part, be copied or redistributed without consent from T. Rowe Price.
The material is not intended for use by persons in jurisdictions which prohibit or restrict the distribution of the material and in certain countries the material is provided upon specific request. It is not intended for distribution to retail investors in any jurisdiction.

Sébastien Page is head of Global Multi-Asset and chief investment officer. He is a member of the Asset Allocation Committee, which is responsible for tactical investment decisions across asset allocation portfolios. Sébastien also is a member of the Management Committee of T. Rowe Price Group, Inc.