November 2023 / INVESTMENT INSIGHTS
Integrating ESG Preferences in Asset Allocation
Optimizing with an added ESG risk constraint.
Key Insights
- Incorporating ESG factors into our investment process alongside economic, valuation and other factors can help our clients to meet their long-term goals.
- We show how scores from our proprietary Responsible Investment Indicator Model (RIIM) can help to drive asset allocation in ESG-aware multi-asset portfolios.
- Our framework allows us to adjust portfolio asset allocation in order to incorporate ESG preferences in a consistent manner.
We introduced an asset allocation framework for incorporating ESG preferences systematically in an earlier paper¹. It used hypothetical examples to illustrate how to add a third dimension to the traditional two-dimensional efficient frontier of portfolio returns and risk, allowing investors to take into consideration their ESG risk tolerance - in addition to return and risk objectives - when constructing a multi-asset portfolio.
This paper is a natural extension to the first whereby the focus of the paper is on optimization around specific ESG pillars. We rely primarily on our proprietary Responsible Investment Indicator Model (RIIM), which develops an environmental, social and governance profile for corporate, sovereign, municipal and securitized securities using both qualitative and quantitative measures.
It provides a systematic framework for measuring and comparing the ESG characteristics of over 15,000 corporate securities in addition to sovereign, securitized and municipal issuers. Because this model sets a common language for our investors to evaluate ESG risks across asset classes, the ESG scores from RIIM can be used to help drive the asset allocation of ESG-aware portfolios, with the ability to focus on specific sustainability topics.
More specifically, RIIM produces scores for each of the three pillars of ESG – environmental, social and governance. Instead of utilizing aggregate ESG risk scores, we can focus on specific environmental, social, or governance aspects in building the overall score for each asset class. Disaggregating the ratings allows us to consider the elements within ESG that are the more relevant for each investor or strategy.
Before delving into the details, it is worth noting that while RIIM is our preferred ESG risk rating framework, the same asset allocation approach works for other ESG scoring systems too. What is important is that ratings across asset classes should be based on a single source of ESG risk scores so that they can be compared consistently.
For illustration purposes, we have constructed a series of multi-asset portfolios that focus on environmental risks. The same approach can be applied to ESG social and governance risks as well.
Investment Assumptions and Constraints
Our starting point is a balanced portfolio consisting of 60% global equities and 40% global bonds. We then apply the following assumptions and constraints to the portfolio design:
- The investment universe is comprised of major regional equity building blocks (i.e., the U.S., Europe, Japan, and Emerging Markets) and fixed income sectors (i.e., Global Aggregate, Global High Yield, and Emerging Markets Bonds) in order to construct a diversified global portfolio.
- Return forecasts for different asset classes are based on our 5-year Capital Markets Assumptions (CMAs). Volatilities are constructed using historical return data over the past 5 years to reflect the most recent market environment (See Figures 1 and 2).
- Environmental risk scores are aggregated scores of individual securities at the asset class level based on our RIIM. The higher the score is, the more environmental risk the asset class carries.
- The allocation design of the initial portfolio is illustrated in Figure 3, in which regional equity allocations are based on country weights in the MSCI All Country World Index (ACWI) and fixed income sector allocations are based on the experience of a typical global institutional investor.
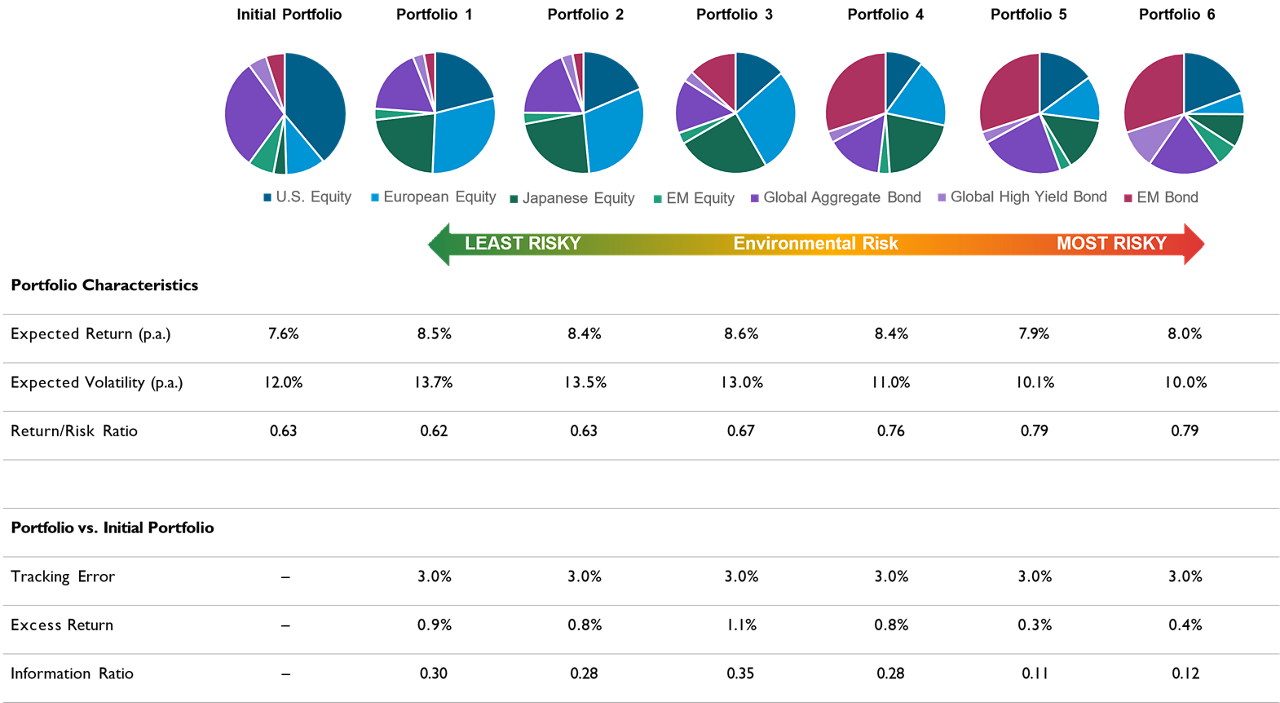
- In the optimization analysis (Figure 4 on the next page), we set a 3.0% limit for the tracking error to the initial portfolio for two reasons: 1) it is an investment constraint common to institutional clients, so it mirrors real world experience; 2) it anchors the portfolio design to the benchmark thereby removing extreme solutions from the optimization process.
- We set the constraint of a minimum single holding allocation of 3% and a maximum single holding allocation of 30% to ensure portfolio diversification and to avoid corner solutions.
- We did not constrain the equity/ fixed income mix in order to leave more room for the optimizer to find allocations with better risk-adjusted returns and mitigated environmental risk.
Assumptions For Portfolio Optimization With ESG Constraints
(Fig. 1)
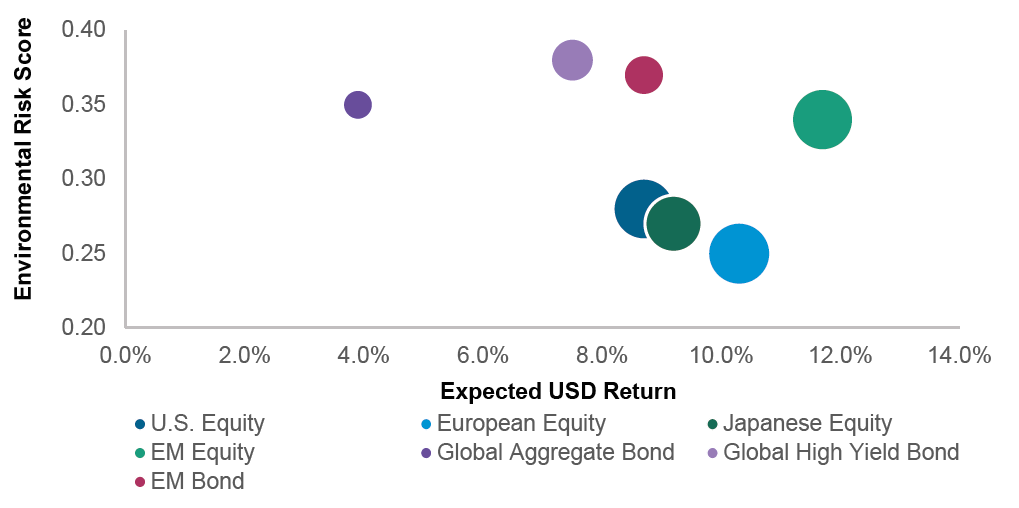
The forecasts contained herein are for illustrative purposes only and are not indicative of future results. Based on T. Rowe Price 5-Year Capital Markets Assumptions (CMAs) and RIIM Model.
In Figure 1 the size of each bubble is proportional to the volatility of each asset class.
As of June 30, 2023.
Sources: Ice BofA, J.P. Morgan, S&P, MSCI, Bloomberg Finance L.P. Analysis by T. Rowe Price. See Additional Disclosures for sourcing information.
This information is not intended to be investment advice or a recommendation to take any particular investment action. Forecasts are based on subjective estimates about market environments that may never occur. See the Appendix for Important Information on our capital market assumption and a representative list of indexes for the seven asset classes in Figure 1.
Expected returns are shown for asset classes without consideration of fees and expenses.
Asset Class Past 5-Year Monthly U.S. Dollar Return Correlations
(Fig. 2)
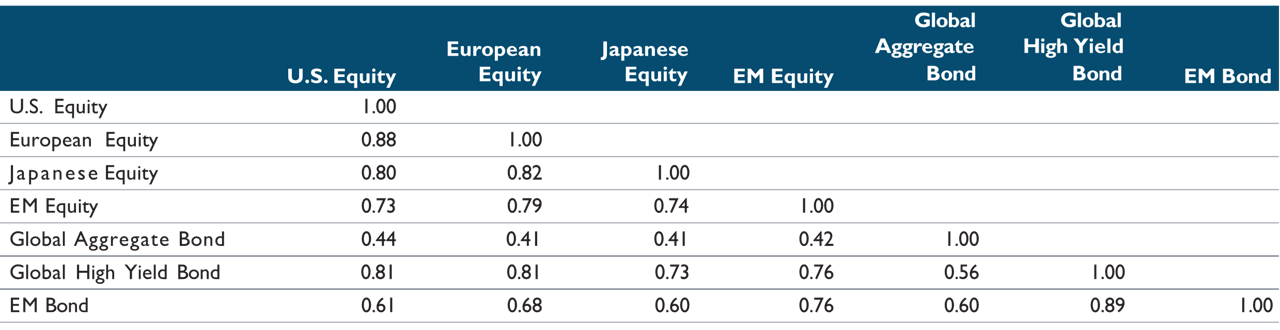
As of June 30, 2023.
Sources: Ice BofA, J.P. Morgan, S&P, MSCI, Bloomberg Finance L.P. Analysis by T. Rowe Price. See Additional Disclosures for sourcing information.
See Appendix for a representative list of indexes.
The Initial Portfolio
(Fig. 3)
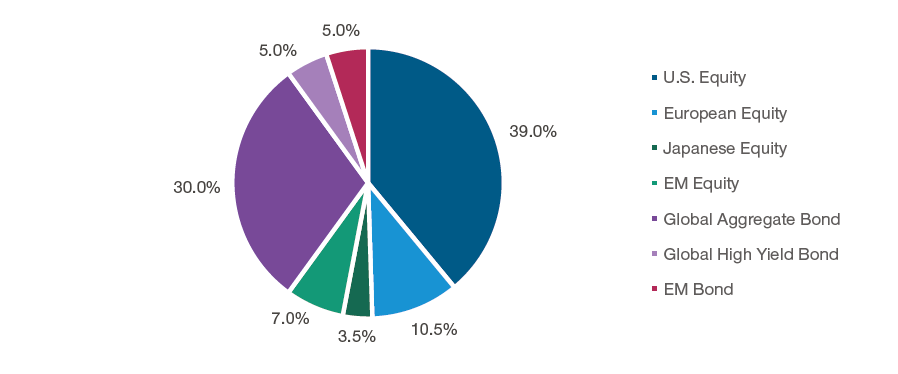
For illustrative purposes only (subject to change without further notice). As of June 30, 2023.
Source: T. Rowe Price.
See Appendix for a representative list of indexes.
Optimization Results Summary For Environmental Risk-Constrained Portfolios
(Fig. 4) Returns are in U.S. dollars
As of June 30, 2023.
The forecasts contained herein are for illustrative purposes only and are not indicative of future results. Based on T. Rowe Price 5-Year Capital Markets Assumptions (CMAs) and RIIM Model.
Sources: Ice BofA, J.P. Morgan, S&P, MSCI, Bloomberg Finance L.P. Analysis by T. Rowe Price. See Additional Disclosures for sourcing information.
This information is not intended to be investment advice or a recommendation
to take any particular investment action. Forecasts are based on subjective estimates about market environments that may never occur. See the Appendix for Important Information on our capital market assumption and a representative list of indexes for the seven asset classes.
Expected returns are shown for asset classes without consideration of fees and expenses.Expected returns are shown for asset classes without consideration of fees and expenses.
Optimization Results
Figure 4 above summarizes the optimization results of asset allocation across a range of different environmental risk tolerance levels. Starting from Portfolio 6 – the portfolio with no consideration given to environmental risk and which hence has the highest environmental risk score, a standard mean-variance optimizer would assign a significant overweight to Emerging Markets Bonds and Global High Yield Bonds. The reasons behind this are two-fold: 1) The two asset classes have attractive risk-adjusted returns base on our 5-year CMAs; 2) These two credit asset classes have high correlations to equity assets and thus act as equity substitutes in the optimized portfolio.
As we decrease our tolerance for environmental risk moving toward the left-hand side of Figure 4, we observe reallocations from higher environmental risk assets, such as Emerging Markets Bond and Global High Yield Bond, to lower environmental risk assets like European and Japanese Equities. Interestingly, the allocation to U.S. Equity, which has higher environmental risk than its developed market peers, starts to increase as we further reduce environmental risk tolerance. This is likely due to the optimizer’s attempt to use U.S. equity exposure to substitute for Emerging Markets Bond allocation to lower the overall environmental risk of the portfolio. The impact on the risk and return, however, does not follow a linear pattern.
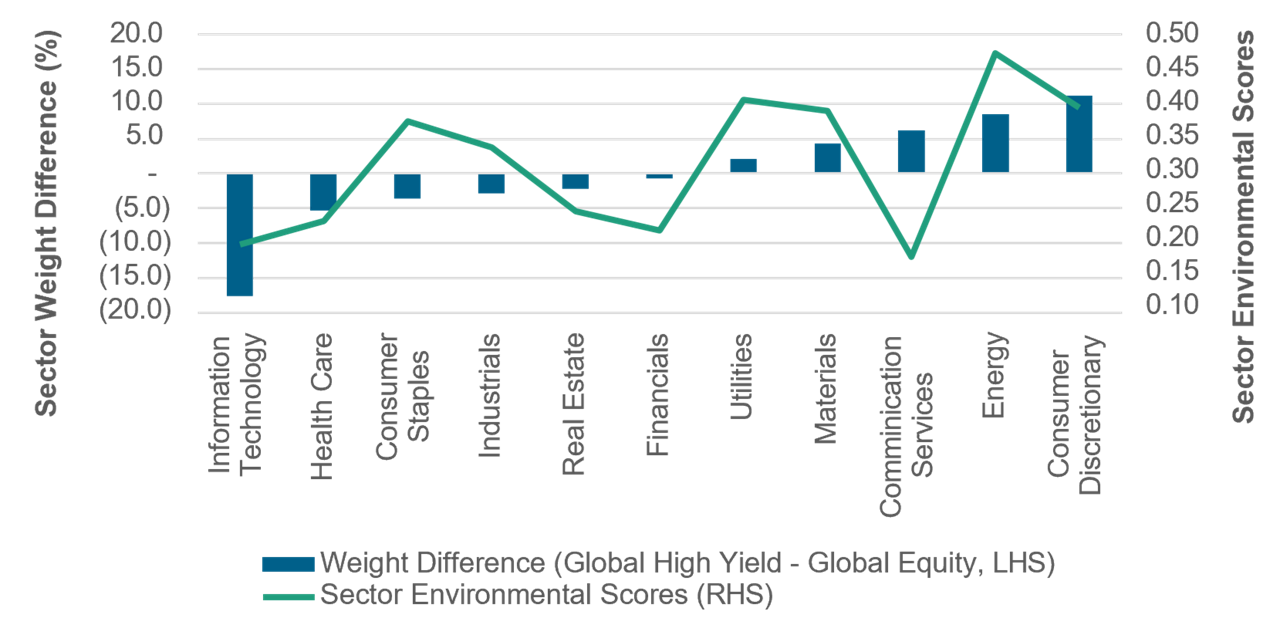
It turns out that this can be explained by their sector exposure differences to a large extent. As shown in Figure 5, compared to Global Equity, Global High Yield tends to overweight sectors with higher environmental risks, such as Consumer Discretionary and Energy, while underweighting sectors such as Information Technology and Health Care, which tend to be associated with lower environment risks.
Conclusion
In this simple illustrative exercise, we developed a framework to help investors adjust asset allocation and incorporate their ESG preferences in a consistent manner.
A Comparison Between Global High Yield and Global Equity
(Fig. 5)
As of June 30, 2023.
Source: ICE BofA, MSCI, Bloomberg Finance L.P. Analysis by T. Rowe Price. See Additional Disclosures for sourcing information.
Sector Environmental Scores are based on RIIM Model. See Appendix for a representative list of indexes.
Appendix
T. Rowe Price Capital Market Assumptions:
The information presented herein is shown for illustrative, informational purposes only. Forecasts are based on subjective estimates about market environments that may never occur. This material does not reflect the actual returns of any portfolio/ strategy and is not indicative of future results. The historical returns used as a basis for this analysis are based on information gathered by T. Rowe Price and from third party sources and have not been independently verified. The asset classes referenced in our capital market assumptions are represented by broad-based indices, which have been selected because they are well known and are easily recognizable by investors. Indices have limitations due to materially different characteristics from an actual investment portfolio in terms of security holdings, sector weightings, volatility, and asset allocation. Therefore, returns and volatility of a portfolio may differ from those of the index. Management fees, transaction costs, taxes, and potential expenses are not considered and would reduce returns. Expected returns for each asset class can be conditional on economic scenarios; in the event a particular scenario comes to pass, actual returns could be significantly higher or lower than forecast.
List of Representative Indices for Each Asset Class
The following indices represented each asset class in the empirical analysis in this paper:
U.S. Equity: S&P 500 Index European Equity: MSCI Europe Index Japanese Equity: MSCI Japan Index
EM Equity: MSCI Emerging Markets Index
Global Aggregate Bond: Bloomberg Global Aggregate Bond Index USD Hedged Global High Yield: ICE BofA Global High Yield Index
EM Bond: J.P. Morgan CEMBI Broad Diversified Composite Index Global Equity: MSCI All Country World Index
Additional Disclosure
MSCI – MSCI and its affiliates and third party sources and providers (collectively, “MSCI”) makes no express or implied warranties or representations and shall have no liability whatsoever with respect to any MSCI data contained herein. The MSCI data may not be further redistributed or used as a basis for other indices or any securities or financial products. This report
is not approved, reviewed, or produced by MSCI. Historical MSCI data and analysis should not be taken as an indication or guarantee of any future performance analysis, forecast or prediction. None of the MSCI data is intended to constitute investment advice or a recommendation to make (or refrain from making) any kind of investment decision and may not be relied on as such.
S&P – The S&P500 is a product of S&P Dow Jones Indices LLC, a division of S&P Global, or its affiliates (“SPDJI”) and [Third Party Licensor], and has been licensed for use by T. Rowe Price. Standard & Poor’s® and S&P® are registered trademarks of Standard & Poor’s Financial Services LLC, a division of S&P Global (“S&P”); Dow Jones® is a registered trademark of Dow Jones Trademark Holdings LLC (“Dow Jones”); [Third Party Licensor Trademarks] are trademarks of the [Third Party Licensor] and these trademarks have been licensed for use by SPDJI and sublicensed for certain purposes by T. Rowe Price. [Licensee’s Product(s)] is not sponsored, endorsed, sold or promoted by SPDJI, Dow Jones, S&P, their respective affiliates, or [Third Party Licensor] and none of such parties make any representation regarding the advisability of investing in such product(s) nor do they have any liability for any errors, omissions, or interruptions of the [Index].
ICE BofA – ICE Data Indices, LLC (“ICE DATA”), is used with permission. ICE DATA, ITS AFFILIATES AND THEIR RESPECTIVE THIRD-PARTY SUPPLIERS DISCLAIM ANY AND ALL WARRANTIES AND REPRESENTATIONS, EXPRESS AND/OR IMPLIED, INCLUDING ANY WARRANTIES OF MERCHANTABILITY OR FITNESS FOR A PARTICULAR PURPOSE OR USE, INCLUDING THE INDICES, INDEX DATA AND ANY DATA INCLUDED IN, RELATED TO, OR DERIVED THEREFROM. NEITHER ICE DATA, ITS AFFILIATES NOR THEIR RESPECTIVE THIRD-PARTY SUPPLIERS SHALL BE SUBJECT TO ANY DAMAGES OR LIABILITY WITH RESPECT TO THE ADEQUACY, ACCURACY, TIMELINESS OR COMPLETENESS OF THE INDICES OR THE INDEX DATA OR ANY COMPONENT THEREOF, AND THE INDICES AND INDEX DATA AND ALL COMPONENTS THEREOF ARE PROVIDED ON AN “AS IS” BASIS AND YOUR USE IS AT YOUR OWN RISK. ICE DATA, ITS AFFILIATES AND THEIR RESPECTIVE THIRD-PARTY SUPPLIERS DO NOT SPONSOR, ENDORSE, OR RECOMMEND T. ROWE PRICE OR ANY OF ITS PRODUCTS OR SERVICES.
J.P. Morgan – Information has been obtained from sources believed to be reliable but J.P. Morgan does not warrant its completeness or accuracy. The index is used with permission. The Index may not be copied, used, or distributed without J.P. Morgan’s prior written approval. Copyright © 2023, J.P. Morgan Chase & Co. All rights reserved.
IMPORTANT INFORMATION
This material is being furnished for general informational and/or marketing purposes only. The material does not constitute or undertake to give advice of any nature, including fiduciary investment advice, nor is it intended to serve as the primary basis for an investment decision. Prospective investors are recommended to seek independent legal, financial and tax advice before making any investment decision. T. Rowe Price group of companies including T. Rowe Price Associates, Inc. and/or its affiliates receive revenue from T. Rowe Price investment products and services. Past performance is not a reliable indicator of future performance. The value of an investment and any income from it can go down as well as up. Investors may get back less than the amount invested.
The material does not constitute a distribution, an offer, an invitation, a personal or general recommendation or solicitation to sell or buy any securities in any jurisdiction or to conduct any particular investment activity. The material has not been reviewed by any regulatory authority in any jurisdiction.
Information and opinions presented have been obtained or derived from sources believed to be reliable and current; however, we cannot guarantee the sources’ accuracy or completeness. There is no guarantee that any forecasts made will come to pass. The views contained herein are as of the date noted on the material and are subject to change without notice; these views may differ from those of other T. Rowe Price group companies and/or associates. Under no circumstances should the material, in whole or in part, be copied or redistributed without consent from T. Rowe Price.
The material is not intended for use by persons in jurisdictions which prohibit or restrict the distribution of the material and in certain countries the material is provided upon specific request. It is not intended for distribution to retail investors in any jurisdiction.
November 2023 / INVESTMENT INSIGHTS

Wenting Shen is a solutions strategist and portfolio manager in the Multi-Asset Division. She is responsible for engaging clients and prospects in the Asia-Pacific region in consultative discussions to identify how T. Rowe Price can best meet their investment needs and objectives through the firm's broad equity, fixed income, and asset allocation investment capabilities. She is a vice president of T. Rowe Price Group, Inc., and T. Rowe Price Singapore Private Ltd.

Nathan Wang is a senior solutions analyst for the Multi-Asset Solutions team in the Multi-Asset Division. He is a vice president of T. Rowe Price Hong Kong Limited.