August 2023 / MARKETS & ECONOMY
Global Markets Monthly Update
Key Insights
- Stocks in most developed markets gave back some of their recent gains, while shares in emerging markets fell sharply, due in part to signs of a slowdown in China.
- Conversely, longer-term bond yields rose sharply in the U.S., as some signals suggested that the economy was picking up renewed momentum.
- The unemployment rate in the eurozone remained at a record low, raising hopes that the region might be able to skirt a recession, as well.
U.S.
The S&P 500 Index recorded its first monthly decline since February as long-term bond yields increased on positive economic signals. The typically defensive utilities and consumer staples sectors performed worst within the index, while energy stocks managed a small gain. Growth stocks held up better than value shares among large-caps, but the reverse was true among small-caps, which lagged overall. While mega-cap technology shares generally underperformed, enthusiasm over the prospects for generative artificial intelligence (AI) appeared to provide a continued tailwind to parts of the tech sector, especially AI chipmaker NVIDIA.
The U.S. was the worst-performing major government bond market in August as long-term yields increased while short-term yields decreased slightly. The yield on the benchmark 10-year U.S. Treasury note briefly traded above 4.35%, its highest level since late 2007. Expectations for higher levels of issuance by the Treasury Department seemed to help push yields higher early in the month.
Consumer Spending Remains Robust…
Good news on the economy appeared to be bad news for stocks for much of August, given the implications for Federal Reserve policy and interest rates. Stocks took a sharp turn lower at mid-month, following the Commerce Department’s report that retail sales had jumped 0.7% in July, roughly double consensus estimates. While retail sales were essentially flat over the past year given the equivalent rise in the consumer price index, sales in specific categories indicated a sharp rise in discretionary spending.
At the end of the month, the Commerce Department reported that personal spending jumped 0.8% in July, above expectations and well above a 0.2% increase in consumer prices over the period. Nationwide housing starts also rose more than expected, and in July new home sales reached their highest level since early 2022, despite the 30-year fixed rate mortgage hitting its highest point since 2001. A resilient job market appeared to support consumer finances, with the unemployment rate ticking down to 3.5% in July, while wages grew 4.4% over the 12-month period, unchanged from June.
…While Businesses Pull Back
The outlook for business spending remained more muted. Durable goods orders, excluding defense and transportation—commonly accepted as a proxy for business investment—rose 0.1% in July, but this was more than offset by a downwardly revised 0.4% contraction in June. S&P Global’s index of manufacturing activity also fell more than expected in August, reversing most of July’s strong gain and moving further back into contraction territory. Industrial production grew by 1.0% in July, roughly triple consensus estimates and its biggest gain since January, although part of the increase came from utilities boosting output to cope with July’s extremely high temperatures.
Late in the month, Federal Reserve Chair Jerome Powell gave some indication of how he was interpreting these mixed signals at his speech before the central bank’s annual symposium in Jackson Hole, Wyoming. Powell acknowledged that higher rates had slowed growth in industrial production and wages, while tightening bank lending standards were also cooling the economy. On the other hand, he noted that economic growth remained above its longer-term trend and that the housing sector appeared to be “picking back up” after slowing sharply over the past year and a half. “As is often the case,” he concluded, “we are navigating by the stars under cloudy skies.”
Europe
In local currency terms, the pan-European STOXX Europe 600 Index lost ground as the economic outlooks for the eurozone and China worsened. However, the benchmark pared its losses at the end of the month, after data showed core inflation might have peaked. Major indexes in Germany, Italy, France, and the UK also fell.
Changes in the interest rate outlook sparked volatility in government bond markets. European yields broadly climbed at the start of the month as resilient economic data suggested a global recession might be avoided. However, yields ended the month lower as core inflation data and comments from policymakers suggested that the European Central Bank (ECB) could be nearing the end of its monetary policy tightening cycle.
BoE Raises Interest Rates to “Restrictive” Level
The Bank of England (BoE) raised its key interest rate by a quarter of a percentage point to a 15-year high of 5.25%. It warned that rates were likely to stay high for some time, promising that policymakers would “ensure that Bank Rate is sufficiently restrictive for sufficiently long to return inflation to the 2% target.” The statement fueled expectations that UK interest rates were now close to a peak. The central bank also projected that the inflation rate would fall to 4.9% by the end of this year, a faster pace than in its May forecast. BoE estimates for economic growth were little changed at 0.5% for this year and 2024.
Eurozone Core Inflation Slows, Labor Market Still Tight
The annual inflation rate in the eurozone was steady at 5.3% in August, a preliminary estimate from Eurostat showed. The result was slightly higher than the 5.1% expected by economists polled by FactSet. The core (less food and energy) inflation rate showed signs of improvement, however, cooling to 5.3% from the 5.5% registered in July.
The labor market in the euro area remained robust, suggesting that a soft landing may still be possible for the slowing economy, the ECB said in the minutes of its July meeting. The seasonally adjusted unemployment rate stayed at a record low of 6.4% in July, matching a consensus forecast in a poll of economists by FactSet.
Eurozone Economy Rebounds but PMIs Point to Third-Quarter Slowdown
Gross domestic product (GDP) in the eurozone expanded 0.3% sequentially in the second quarter, after shrinking or stagnating in the previous six months. Even so, forward-looking purchasing managers’ surveys compiled by S&P Global indicated that third-quarter economic growth could be anemic. The Purchasing Managers’ Index (PMI) for manufacturing came in at 43.7 in August—a slight improvement from July but still well below 50, the level that indicates a contraction in activity. Meanwhile, the PMI reading for the services sector dipped below 50. The HCOB Flash Eurozone Composite PMI Output Index, which combines data from both sectors, fell to a 33-month low of 47.0 from 48.6 in July.
Japan
Japanese equities were rangebound in August, generating a muted return in local currency terms but outperforming most other markets in a volatile month dominated by concerns about the broader impact of China’s macroeconomic weakness and its troubled property sector. However, sentiment was boosted by Japan’s much stronger-than-expected second-quarter economic growth, as well as a strong corporate earnings season, with many Japanese companies seeing output recover post-pandemic and benefiting from the weak yen and rising prices.
Historic Yen Weakness Prompts Speculation About Intervention
The yen weakened to about JPY 145.54 against the U.S. dollar, from the prior month’s JPY 142.27, trading around the levels that prompted Japanese authorities to intervene in the foreign exchange market in September 2022 to stem the yen’s decline. Japan’s Finance Minister Shunichi Suzuki continued to assert that authorities are watching market moves with a strong sense of urgency and will respond appropriately to speculative moves that have the potential to affect companies’ future planning and households’ prospects.
The yield on the 10-year Japanese government bond rose to 0.65%, from 0.61% at the end of July, at one point reaching the highest level in almost a decade. The recent shift in the Bank of Japan’s (BoJ’s) yield curve control strategy, favoring more flexibility and less direct intervention, prompted selling of Japanese debt.
Second-Quarter Economic Growth Far Exceeds Forecasts
Japan’s GDP grew by an annualized 6.0% in the second quarter, far exceeding the 2.9% consensus forecast. The surge in growth was driven largely by external demand, with net export growth ahead of estimates. Historic yen weakness continued to boost exports, particularly of cars. This offset weakness in domestic demand, notably a drop in private consumption due in part to the impact of rising prices.
Japan’s consumer price inflation slowed from the previous month in July but remained elevated at 3.1% year on year, above the BoJ’s 2% target for the 16th straight month. Flash composite PMI data, combining both manufacturing and services sector activity, rose to 52.6 in August, up from 52.2 in July. And while factory activity shrank for a third consecutive month in August, data showed the pace of decline was slowing.
Government Pledges Measures to Ease Record-High Fuel Prices
Seeking to alleviate the effects of high fuel costs on households and businesses, Japan’s government pledged measures to ease record-high gasoline prices and to extend its subsidy program for oil wholesalers beyond September until the end of the year.
While the weak yen has pushed up gas prices, the government’s subsidies have helped keep overall levels of inflation down, supporting the case for the BoJ to maintain its accommodative stance. BoJ Board member Toyoaki Nakamura reiterated that monetary easing needs to be persistently maintained in pursuit of the central bank’s inflation target and that any policy pivot will take time.
China
Chinese equities retreated amid mounting concerns about the country’s economic slowdown. The MSCI China Index sank 8.95% while the China A Onshore Index fell 8.05%, both in U.S. dollar terms.
Inflation data revealed that consumer and producer prices fell in tandem for the first time since November 2020, underscoring the weak demand throughout the economy. The consumer price index declined 0.3% in July from a year earlier, marking its first negative print since February 2021. The producer price index fell a worse-than-expected 4.4% from a year ago but slowed from June’s 5.4% decline.
Other readings showed that China’s economy continued to lose momentum. Industrial output, retail sales, and fixed asset investment grew at a slower-than-expected pace in July, while urban unemployment edged up to 5.3% from June’s 5.2%. China’s statistics bureau did not release the youth unemployment rate, which has increased every month this year and hit a record 21.3% in June.
Property Sector Continues to Struggle
More bad news from China’s debt-ridden property sector also weighed on sentiment. Country Garden, one of the country’s largest property developers that has yet to default, missed interest payments on two dollar-denominated bonds due to liquidity problems. The company expects to record a loss in the first half of the year amid falling sales and rising refinancing costs. Official data showed that new home prices in 70 of China’s largest cities fell 0.23% in July from June, when they declined for the first time this year.
In monetary policy news, the People’s Bank of China (PBOC) unexpectedly cut its medium-term lending facility rate by 15 basis points to 2.5%, its largest reduction since 2020, to spur demand. The PBOC also trimmed the seven-day reverse repurchase rate, a short-term policy rate. On August 31, the central bank cut the amount of foreign currency deposits that domestic banks must hold as reserves. The reduction in the foreign exchange reserve requirement ratio from 6.0% to 4.0% effectively freed up more foreign currency in the local market to buy the renminbi currency, which fell to its lowest level since 2007 against the U.S. dollar in August.
Other Key Markets
Stocks Rise as Türkiye (Turkey) Returns to More Orthodox Monetary Policy
Turkish stocks, as measured by MSCI, returned 7.63% versus -6.13% for the MSCI Emerging Markets Index.
Toward the end of August, Türkiye’s central bank announced several measures to discourage and reverse the unsustainable accumulation of, and costs associated with, bank deposits protected from losses stemming from foreign exchange (FX) fluctuations. Such FX-protected deposits now exceed 3 trillion Turkish lira (USD 125 billion) and have cost the government more than 550 billion lira (USD 20 billion).
According to T. Rowe Price sovereign analyst Peter Botoucharov, these measures represent a positive step toward resolving a large and growing imbalance as well as costs to the government’s budget and to the central bank. However, the process is likely to be slow, and it could take at least three to six months before the level of FX-protected deposits drops to more manageable levels.
A few days later, Türkiye’s central bank surprised investors with a larger-than-expected increase in its key interest rate, the one-week repo auction rate, from 17.50% to 25.00%. According to the central bank’s post-meeting statement, policymakers acknowledged that there has been “a continued increase in the underlying trend” of inflation—the consumer price index jumped to a year-over-year rate of 47.8% in July versus 38% in June. They also asserted that their monetary tightening efforts “will be further strengthened as much as needed in a timely and gradual manner until a significant improvement in the inflation outlook is achieved.” In addition, they stated that they will continue to gradually “simplify and improve the existing micro- and macroprudential framework.”
Botoucharov believes that this is another step in the right direction in terms of Türkiye returning to more orthodox monetary policymaking. He also believes simplification and removal of macroprudential regulations could foster more normal functioning of the local interest rate markets and provide greater stability of the lira in the foreign exchange markets.
Peru’s Central Bank Keeps Rates Steady, Equities Decline
Stocks in Peru, as measured by MSCI, returned -6.98%, slightly worse than the MSCI Emerging Markets Index.
As the month began, the government reported that the consumer price index for July increased 0.39% month over month and 5.88% year over year—sharply lower than the year-over-year rate of 6.46% in June. The data were essentially in line with market expectations.
T. Rowe Price emerging markets sovereign analyst Aaron Gifford was encouraged that both headline and core inflation were just under 2%, well within the central bank’s 1% to 3% inflation target range. Later in the month, when Peru’s central bank held its policy meeting, policymakers decided—as was widely expected—to keep the key policy rate, the reference rate, at 7.75%.
With high real (inflation-adjusted) rates by Peruvian standards, weak growth, and rapidly improving inflation, Gifford believes that the beginning of a rate-cutting cycle is near. However, he expects that the central bank, when it acts, will reduce its key policy rate at a gradual pace until it reaches a neutral stance.
Major Index Returns
Total returns unless noted
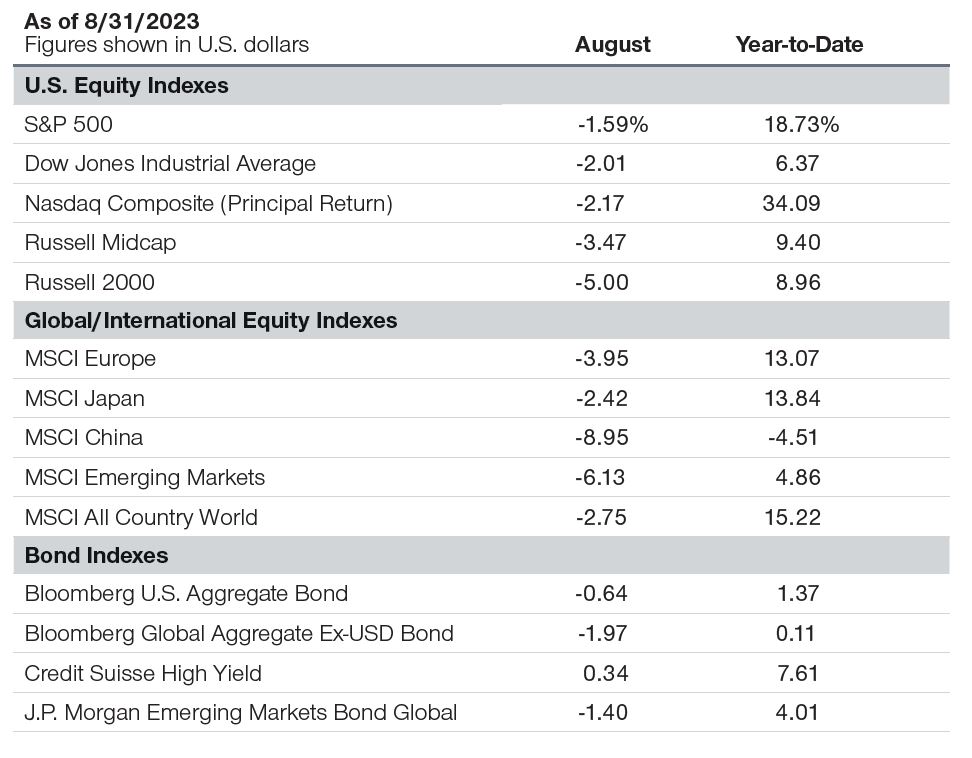
Past performance is not a reliable indicator of future performance.
Note: Returns are for the periods ended August 31, 2023. The returns include dividends and interest income based on data supplied by third‑party providerRIMES and compiled by T. Rowe Price, except for the Nasdaq Composite Index, whose return is principal only.
Sources: Standard & Poor’s, LSE Group, Bloomberg Index Services Limited, MSCI, Credit Suisse, Dow Jones, and J.P. Morgan (see Additional Disclosures).
Past performance is not a reliable indicator of future performance.
The specific securities identified and described are for informational purposes only and do not represent recommendations.
Additional Disclosure
The S&P 500 Index is a product of S&P Dow Jones Indices LLC, a division of S&P Global, or its affiliates (“SPDJI”) and has been licensed for use by T. Rowe Price. Standard & Poor’s® and S&P® are registered trademarks of Standard & Poor’s Financial Services LLC, a division of S&P Global (“S&P”); Dow Jones® is a registered trademark of Dow Jones Trademark Holdings LLC (“Dow Jones”); T. Rowe Price is not sponsored, endorsed, sold or promoted by SPDJI, Dow Jones, S&P, their respective affiliates, and none of such parties make any representation regarding the advisability of investing in such product(s) nor do they have any liability for any errors, omissions, or interruptions of the S&P 500 Index.
London Stock Exchange Group plc and its group undertakings (collectively, the “LSE Group”). © LSE Group 2023. FTSE Russell is a trading name of certain of the LSE Group companies. “Russell®” is a trade mark(s) of the relevant LSE Group companies and is used by any other LSE Group company under license. All rights in the FTSE Russell indexes or data vest in the relevant LSE Group company which owns the index or the data. Neither LSE Group nor its licensors accept any liability for any errors or omissions in the indexes or data and no party may rely on any indexes or data contained in this communication. No further distribution of data from the LSE Group is permitted without the relevant LSE Group company’s express written consent. The LSE Group does not promote, sponsor or endorse the content of this communication. The LSE Group is not responsible for the formatting or configuration of this material or for any inaccuracy in T. Rowe Price Associates’ presentation thereof.
MSCI and its affiliates and third party sources and providers (collectively, “MSCI”) makes no express or implied warranties or representations and shall have no liability whatsoever with respect to any MSCI data contained herein. The MSCI data may not be further redistributed or used as a basis for other indices or any securities or financial products. This report is not approved, reviewed, or produced by MSCI. Historical MSCI data and analysis should not be taken as an indication or guarantee of any future performance analysis, forecast or prediction. None of the MSCI data is intended to constitute investment advice or a recommendation to make (or refrain from making) any kind of investment decision and may not be relied on as such.
“Bloomberg®” and Bloomberg U.S. Aggregate Bond, Bloomberg Global Aggregate Ex‑USD are service marks of Bloomberg Finance L.P. and its affiliates, including Bloomberg Index Services Limited (“BISL”), the administrator of the index (collectively, “Bloomberg”) and have been licensed for use for certain purposes by T. Rowe Price. Bloomberg is not affiliated with T. Rowe Price, and Bloomberg does not approve, endorse, review, or recommend its products. Bloomberg does not guarantee the timeliness, accurateness, or completeness of any data or information relating to its products.
© 2023 CREDIT SUISSE GROUP AG and/or its affiliates. All rights reserved.
Information has been obtained from sources believed to be reliable but J.P. Morgan does not warrant its completeness or accuracy. The index is used with permission. The Index may not be copied, used, or distributed without J.P. Morgan’s prior written approval. Copyright © 2023, J.P. Morgan Chase & Co. All rights reserved.
IMPORTANT INFORMATION
This material is being furnished for general informational and/or marketing purposes only. The material does not constitute or undertake to give advice of any nature, including fiduciary investment advice, nor is it intended to serve as the primary basis for an investment decision. Prospective investors are recommended to seek independent legal, financial and tax advice before making any investment decision. T. Rowe Price group of companies including T. Rowe Price Associates, Inc. and/or its affiliates receive revenue from T. Rowe Price investment products and services. Past performance is not a reliable indicator of future performance. The value of an investment and any income from it can go down as well as up. Investors may get back less than the amount invested.
The material does not constitute a distribution, an offer, an invitation, a personal or general recommendation or solicitation to sell or buy any securities in any jurisdiction or to conduct any particular investment activity. The material has not been reviewed by any regulatory authority in any jurisdiction.
Information and opinions presented have been obtained or derived from sources believed to be reliable and current; however, we cannot guarantee the sources’ accuracy or completeness. There is no guarantee that any forecasts made will come to pass. The views contained herein are as of the date noted on the material and are subject to change without notice; these views may differ from those of other T. Rowe Price group companies and/or associates. Under no circumstances should the material, in whole or in part, be copied or redistributed without consent from T. Rowe Price.
The material is not intended for use by persons in jurisdictions which prohibit or restrict the distribution of the material and in certain countries the material is provided upon specific request. It is not intended for distribution to retail investors in any jurisdiction.