March 2022 / VIDEO
Race, Retirement, and the Savings Gap
What can the retirement industry do to narrow racial and ethnic disparities?
Key Insights
- Dramatic racial and ethnic disparities in retirement savings persist in the U.S., with no simple solution.
- Our research shows that Black and Hispanic workers are lagging in plan participation and savings while also facing a greater range of competing financial priorities.
- The retirement industry can act now to help close the gap with thoughtful plan design, wellness and education programs, and improved data‑sharing practices.
Racial and ethnic income and wealth inequality is a growing problem in the United States and has been for some time. The numbers paint a bleak picture. For example, in 2019, white households had a median net worth of $189,100 compared with $24,100 for Black households.1
This dramatic disparity is just as evident in retirement savings. While more than one‑third of Americans’ financial assets are held in retirement accounts2 that have generated vast wealth, not everyone has benefited. Black and Hispanic workers, especially, remain behind their white counterparts when it comes to plan participation, savings, and more.
It is in the interest of all stakeholders, including employers, recordkeepers, financial professionals, and policymakers, to ensure that the benefits of retirement accounts are more broadly and evenly distributed. Stakeholders have the means, right now, to begin narrowing the gap. By optimizing existing plan design features and thoughtfully introducing new ones, we can help improve access to and the outcomes from workplace retirement plans.
Our analysis, using the U.S. Census Bureau’s Current Population Survey3 along with the T. Rowe Price Retirement Savings and Spending Study, pinpoints where the largest retirement savings gaps exist along racial and ethnic lines.
Black and Hispanic Workers Lag in Plan Participation
(Fig. 1) Racial and ethnic gap in retirement plan participation rates among 21‑ to 64‑year‑old wage or salaried workers in the private sector

As of March 2021.
Participation Rate = Share of total private sector workforce (with or without access to a retirement plan)who participate in a retirement plan.
Source: Author’s calculations from the Annual Social and Economic (ASEC) supplement of the CurrentPopulation Survey (CPS), 2021. IPUMS CPS, University of Minnesota.
Access to Retirement Plans: The Root of the Problem
Accumulation of retirement savings is a three‑step problem, each requiring an active decision—participation, contribution, and investment allocation. The adoption of auto features and qualified default investments have helped a lot with the last two.
But widespread participation in retirement plans, the first and the most important of the three steps, remains elusive even with the adoption of auto‑enrollment and after nearly four decades since the emergence of defined contribution plans. The racial gaps in retirement plan participation are particularly stark.
About half (50.2%) of prime‑age workers in the private sector participate in a workplace retirement plan. Participation rates for whites (57.7%) and Asians (54.9%) are above the average. However, Hispanics have the lowest retirement plan participation rates (31.9%) with less than one in three participating in a retirement plan. And only two in five (40.5%) Blacks participate in a retirement plan.
To understand how access to a retirement plan is at the root of the retirement savings problem, we need to look at the takeup rates (the share of workers who decide to participate in a retirement plan if they are offered one).
A vast majority of private sector workers (88.2%) participate in a retirement plan if they are offered one. The racial and ethnic gaps in plan participation also narrow down significantly. Compared with whites (90.4%), Blacks (81.6%) and Hispanics (82.2%) have only slightly lower takeup rates.
Racial and Ethnic Gaps Narrow Among Those With Access
(Fig. 2) Racial and ethnic gap in takeup rates among 21‑ to 64‑year‑old wage or salaried workers in the private sector

As of March 2021.
Takeup Rate = Share of workers who decide to participate in a retirement plan if they are offered one.
Source: Author’s calculations from the Annual Social and Economic (ASEC) supplement of the Current Population Survey (CPS), 2021. IPUMS CPS, University of Minnesota.
Larger Firms Have Higher Participation Rates
(Fig. 3) Retirement plan participation rates and distribution of workers of different racial and ethnic groups across different firm sizes
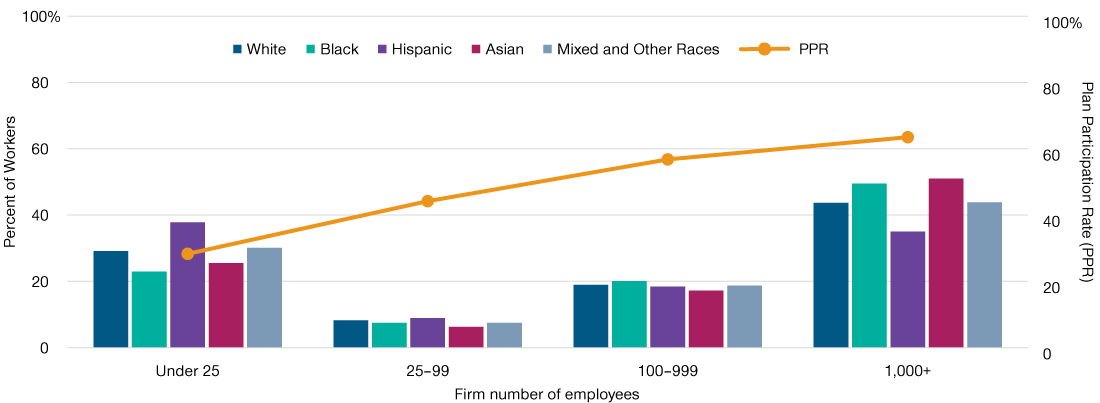
As of March 2021.
Participation Rate = Share of total private sector workforce (with or without access to a retirement plan) who participate in a retirement plan.
Percent of Workers measures the share of each race or ethnicity employed across different firm sizes.
Source: Author’s calculations from the Annual Social and Economic (ASEC) supplement of the Current Population Survey (CPS), 2021. IPUMS CPS, University of Minnesota.
Access has been a persistent problem. Some employers, particularly small employers, struggle to offer their employees a retirement plan. For them, the administrative burden of setting up a retirement plan in compliance with various regulatory requirements could be daunting. Cost could also be a prohibiting factor for them, and offering other benefits such as health insurance might take precedence over retirement plans. As a result, many small employers don’t offer a retirement plan.
As expected, our research suggests a strong positive correlation between firm size and retirement plan participation. For smaller firms with less than 25 employees, only 28.3% participate in a retirement plan. Larger firms (more than 1,000 employees) have a much higher participation rate (63.5%).
This matters because small companies employ a disproportionate number of minority workers. For example, a large share of Hispanics (37.8%) and workers from mixed and other races (30.1%) work for small firms (less than 25 employees), which are less likely to offer retirement plans.
Again, to understand how lack of access is driving the difference in plan participation rates across firms of different sizes, we look at takeup rates. There is virtually no difference in takeup rates among employees of smaller firms and larger firms. Clearly, the combined effect of the inability of smaller firms to offer a retirement plan and large shares of minorities working for those smaller firms is contributing to the racial and ethnic gaps in participation rates. Improving the number of small businesses offering retirement plans could help close the racial gap in retirement savings. To address this issue, some states have started automatic individual retirement account (auto-IRA) programs that provide easy access to a state‑sponsored IRA for workers whose employers don’t offer a retirement plan. These programs may help to narrow the retirement savings gap.
Firm Size Becomes Irrelevant Among Those With Access
(Fig. 4) Takeup rates among eligible employees between 21- and 64‑year‑old wage or salaried workers in the private sector, by race/ethnicity and firm size
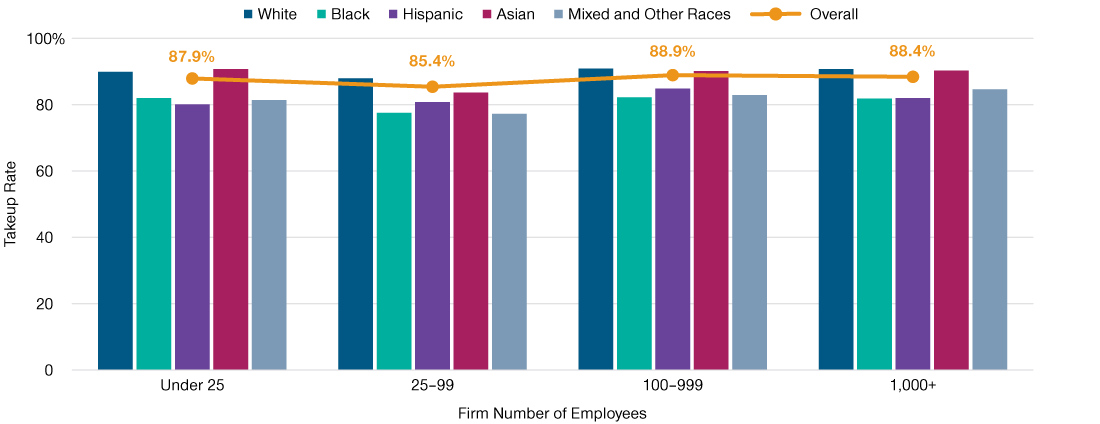
As of March 2021.
Takeup Rate = Share of workers who decide to participate in a retirement plan if they are offered one.
Source: Author’s calculations from the Annual Social and Economic (ASEC) supplement of the Current Population Survey (CPS), 2021. IPUMS CPS, University of Minnesota.
But access to a retirement plan is not the only obstacle that workers need to overcome in seeking to accumulate retirement savings. Some workers with access to retirement plans might decide not to participate or to opt out of their plan. These eligible nonparticipants illustrate how the pressure of other financial constraints can prevent workers from building a nest egg. Looking at the share of eligible nonparticipants across different races provides a more nuanced understanding of the participation problem.
Nonparticipation Is Highest Among Black Workers
(Fig. 5) Share of eligible nonparticipants among 21- to 64‑year‑old wage or salaried workers in the private sector, by race and ethnicity

As of March 2021.
Nonparticipation Rate = Share of total private sector workforce (with and without access to a retirementplan) who decline to participate when offered a retirement plan.
Source: Author’s calculations from the Annual Social and Economic (ASEC) supplement of the Current Population Survey (CPS), 2021. IPUMS CPS, University of Minnesota.
Overall, about 7% of prime‑age workers who are eligible to participate in a retirement plan do not participate. Blacks have the highest rate of eligible nonparticipation as nearly one in ten (9.1%) Black workers decline to participate in a retirement plan. So, they might be facing a higher financial burden, have different financial priorities, and are more constrained by their income. Interestingly, the opt‑out rates for whites and Hispanics are nearly identical. This suggests that access might be the highest hurdle for Hispanics because, given access, they are not any more likely to opt out than white workers. Opt‑out rates are also very high among mixed races, almost equaling that of Blacks.
Finally, and most crucially, our research shows that if we combine participants and eligible nonparticipants (50.2% and 6.7%, respectively), that still leaves more than 40% of the private sector workforce that is not eligible or does not have access to any type of retirement savings plan at work. This number needs to go down significantly for retirement plans to become a pillar of wealth creation for all Americans.
Income Inequality Drives the Participation Gap
On average, minority workers earn significantly less than their white counterparts. And, to a large extent, the difference in income drives the difference in plan participation rates.
We see a strong positive relationship between income and retirement plan participation. Among workers making less than $25,000 a year, only 13.5% participate in a retirement plan. Meanwhile, 82.2% of workers making more than $75,000 a year participate in a retirement plan.
The relationship between income and retirement plan participation also helps to explain the racial gaps in retirement plan participation. The two racial groups with the lowest retirement plan participation rates—Hispanics and Blacks—also have the largest share of their workers in the bottom two income groups. Nearly three in four (73.3%) Hispanics and two in three of Black workers earn less than $50,000 annually.
Lower Income Often Means Lower Participation
(Fig. 6) Retirement plan participation rates and distribution of workers of different racial and ethnic groups across different income groups
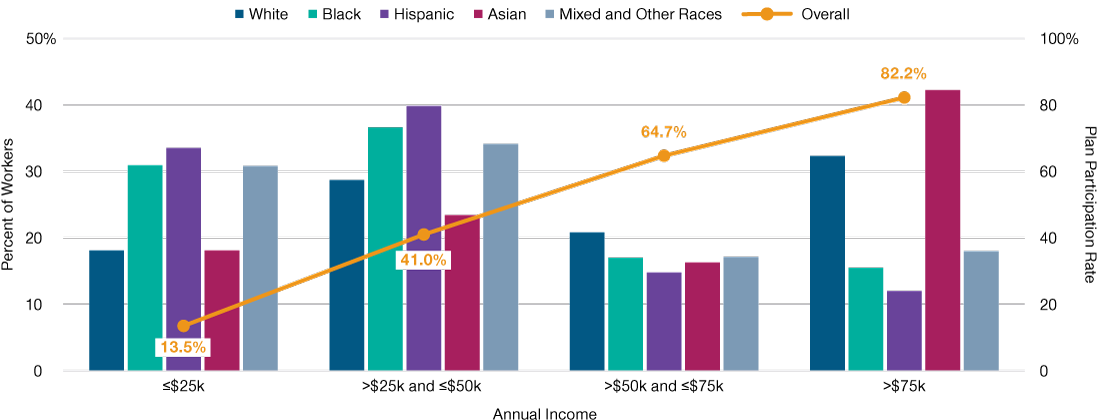
As of March 2021.
Participation Rate = Share of total private sector workforce (with or without access to a retirement plan) who participate in a retirement plan.
Percent of workers measures the share of each race or ethnicity across different income groups.
Source: Author’s calculations from the Annual Social and Economic (ASEC) supplement of the Current Population Survey (CPS), 2021. IPUMS CPS, University of Minnesota.
Effect of Income Gaps Dwarfed by Access
(Fig. 7) Takeup rates among eligible employees between 21- and 64-year-old wage or salaried workers in the private sector, by race/ethnicity and income
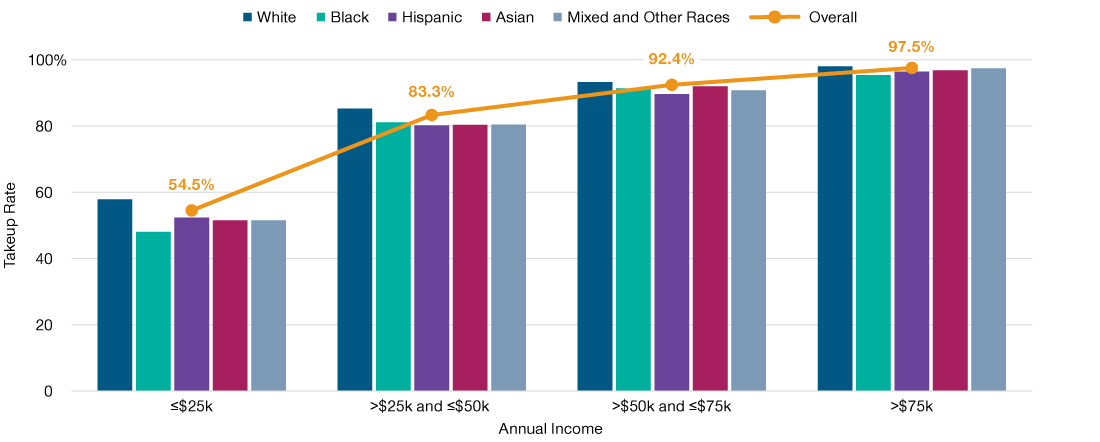
As of March 2021.
Takeup Rate = Share of workers who decide to participate in a retirement plan if they are offered one.
Source: Author’s calculations from the Annual Social and Economic (ASEC) supplement of the Current Population Survey (CPS), 2021. IPUMS CPS, University of Minnesota.
But the difference in plan participation rates across income groups is also highly influenced by access, as shown by the respective takeup rates. Even among the lowest income group (less than $25,000 a year), more than half (54.5%) of workers participate in a retirement plan if they are offered one. For higher income groups, the takeup rate flattens out with virtually everyone (97.5%) with an annual income of $75,000 or above participating in a retirement plan. This shows that low income and access are key barriers to retirement plan participation.
Improving the lifetime income prospects of these minority workers would in turn help improve their retirement security, but this is beyond the scope of the retirement industry alone and will need concerted public policy efforts.
Inadequate Savings: The Challenge of Translating Income Into Savings
The income gap across different racial groups is not the only thing hindering some groups from building up savings and net worth. The savings gap for retirement plan participants is wider than their income gap. This means they face additional challenges when it comes to converting their income into savings and assets.
On average, both Black and Hispanic retirement plan participants roughly earn 73% of their white counterparts. But the gap in their 401(k) balances is wider—58% and 53% for Blacks and Hispanics, respectively. The gap widens even further for net worth. Median net worths of Blacks and Hispanics are at 44% and 45%, respectively, of whites.
The Savings Gap Is Wider Than the Income Gap
(Fig. 8) Income and assets of retirement plan participants of different racial and ethnic groups as a percentage of income and assets of white retirement plan participants

As of March 2021.
Source: Author’s calculations from the Annual Social and Economic (ASEC) supplement of the Current Population Survey (CPS), 2021. IPUMS CPS, University of Minnesota.
Non-white Participants Start Saving Later
(Fig. 9) Age started saving for retirement, by race and ethnicity

As of August 2021.
Source: T. Rowe Price Retirement Savings and Spending Study, 2021. See Additional Disclosures for more information.
The growing racial gap between income and wealth suggests that lower income isn’t the only challenge making it harder for Blacks and Hispanics to save and build wealth. To better understand what else is driving the racial and ethnic gap in retirement savings, we must also look at the realities of savers’ daily financial lives—including financial goals, financial priorities, and expectations around retirement.
A Late Start to Saving
One indicator in our data points to a fundamental principle of saving: Start early and save regularly. The more time someone spends investing in the market, the more time they get to benefit from the wonders of compounding. Sometimes an early start gives a saver a potential advantage that is almost impossible to make up with a higher saving rate and a late start.
Here again, we see a significant gap between whites and other minorities, particularly Blacks. While 38% of white participants say that they started saving for retirement before 30, only 18% of Blacks report doing so. On the other hand, 26% of white participants started to save for retirement after 40 compared with 38% of Hispanic participants. We also found that more minority savers, particularly Blacks, expected to retire earlier than whites. This means that minorities have a shorter window to save and grow their assets. The combined effects of these factors could be highly damaging.
Saving Early Can Make a Large Difference
(Fig. 10) Hypothetical accumulation of retirement savings with early and late starts

As of March 2022.
Assumptions: Example beginning at age 25 assumes a beginning salary of $40,000 escalated 5% a year to age 45 then 3% a year to age 65. Retirement savings is calculated as a beginning savings rate of 6% with a 1% annual increase until 15%. Example beginning at age 40 assumes a beginning salary of $80,000 escalated 5% a year to age 45 then 3% a year to age 65. Retirement savings is calculated as a flat savings rate of 15%. Annual rate of return is assumed to be 7%, which is lower than the average annual return for the S&P 500 index between 1957–2021. All savings are assumed tax‑deferred. This example is hypothetical and for illustrative purposes only and is not meant to represent the performance of any specific investment option. Results do not reflect actual investment results and arenot a guarantee of future results. Actual investment returns and outcomes may differ materially. The assumptions used may not reflect actual market conditions or your specific circumstances and do not account for plan or IRS limits. Results do not include management fees, trading costs, and other related investment fees that would serve to reduce ending balance. Investors cannot invest directly in an index. Please be sure to take all of your assets, income, and investments into consideration in assessing your retirement savings adequacy.
The benefits of starting to save early and consistently are clear. Someone with a starting salary of $40,000 at age 25 who starts to save 6% of her income and increases it gradually to 15% could hypothetically amass close to $2.3 million by age 65. In contrast, someone starting at age 40 with a salary of $80,000 and saving 15% of her income until age 65 will end up with a nest egg of less than $1.3 million. A late start typically carries a high penalty. We believe it is important that all retirement savers, and particularly minority savers, understand this and begin saving early. But this is easier said than done.
The Burden of Debt and Competing Priorities
Debt may also be hindering minority participants’ retirement savings progress. Black and Hispanic participants are more likely to hold every type of debt than their white counterparts. For some debt categories, the differences are significant. For example, while 18% of white participants held student loans, the share among Blacks was more than double at 41%. Prevalence of credit card and medical debt were also higher among Blacks and Hispanics. Finally, although a small share of minority savers held predatory debt like payday loans, even those shares are double their white and Asian counterparts. Debt, unfortunately, can be more detrimental to financial well‑being than other financial troubles.
Minority Participants: More Likely to Carry Debt
(Fig. 11) Different types of debt held by plan participants, by race and ethnicity

As of August 2021.
Source: T. Rowe Price Retirement Savings and Spending Study, 2021. See Additional Disclosures for more information.
Retirement Isn’t the Only Financial Priority
(Fig. 12) Racial and ethnic difference in financial priorities

As of August 2021.
Source: T. Rowe Price Retirement Savings and Spending Study, 2021. See Additional Disclosures for more information.
Minority savers may also be lagging white savers because they have competing financial priorities. To be clear, saving for retirement in a workplace retirement plan is the most important financial objective irrespective of race and ethnicity. But, for minorities, other objectives can be almost equally important or highly important.
For example, while 66% of Black participants describe retirement savings as a major objective, nearly as many (63%) also describe saving for emergencies as a major objective. And 42% of Black participants describe saving for a house down payment as a major objective, compared with only 17% of whites. Reducing debt is also a major objective for more minority savers. In the absence of strong income growth, these competing priorities prevent minority savers from focusing on retirement savings.
Post‑Pandemic Bright Spots and Opportunities for Employers and Financial Professionals
The pandemic had many negative physical, social, and economic effects on people. But there have been a few bright spots related to the financial health of American households. After the initial nosedive, stock markets roared back, the housing market heated up, and household savings swelled. These factors led to some positive financial actions, which were even more pronounced for minorities.
Pandemic Positives: Minorities Took Positive Financial Steps
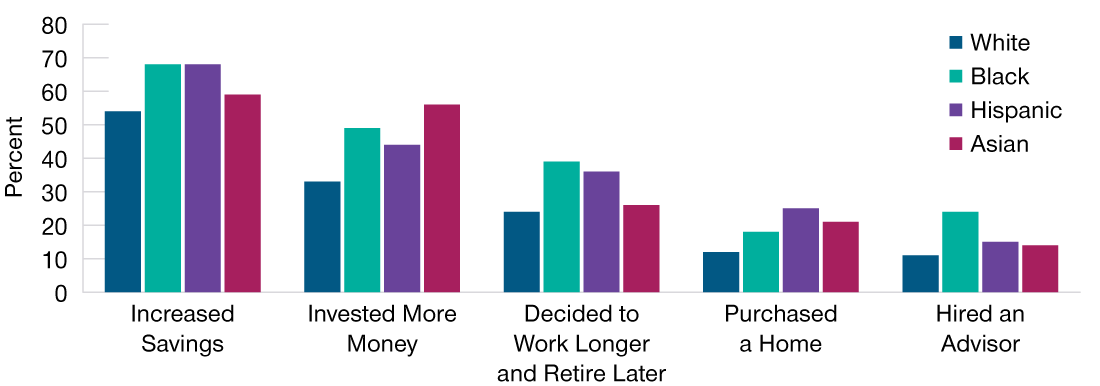
(Fig. 13) Racial and ethnic difference in financial actions taken in the past 12 months
As of August 2021.
Source: T. Rowe Price Retirement Savings and Spending Study, 2021. See Additional Disclosures for more information.
Participants Trust Employers for Financial Advice
(Fig. 14) Percentage of participants relying on workplace for financial advice, by race and ethnicity

As of August 2021.
Source: T. Rowe Price Retirement Savings and Spending Study, 2021. See Additional Disclosures for more information.
Nearly 70% of Black and Hispanic savers increased their savings, nearly half of Black savers invested more money, and a quarter of Hispanic savers purchased a home. Also encouraging, nearly a quarter of Black savers hired an advisor (human or robo). And many have decided to work longer and retire later, which should improve their prospects for a successful retirement.
These are great signs. But given how far behind they are in the saving game, minority savers will need all the help they can get. Fortunately, they are also very receptive to advice and looking for help from the most familiar sources. The workplace remains the most important source of advice and support for all retirement savers, and more so for minority savers.4 This is a great opportunity for employers to try to improve the financial lives of employees who consider the employer a trusted source of financial advice.
Most Participants Say Advice Is Worth Paying For
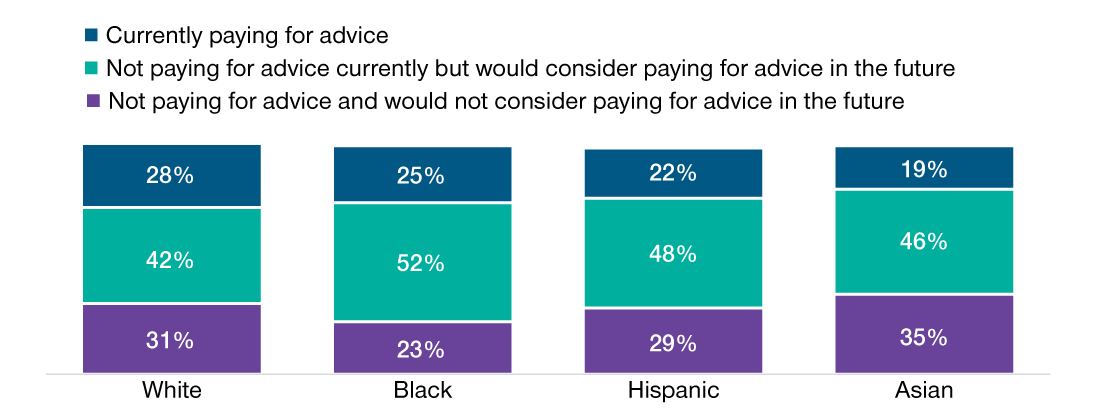
(Fig. 15) Use and openness to paid financial advice, by race and ethnicity
As of August 2021.
Source: T. Rowe Price Retirement Savings and Spending Study, 2021. See Additional Disclosures for more information.
Minority communities are typically underserved by financial advisory firms. But in this shortcoming lies an opportunity. Minority savers rely more on financial advice from non‑self‑directed sources, and they are also willing to pay for such services. Nearly half of Black and Hispanic retirement savers say that they will consider paying for financial advice in the future. Financial services firms and financial professionals should take note and focus on these historically underserved communities.
Solutions to Help Narrow the Gap
Addressing racial and ethnic disparities in retirement savings will not be easy. But there are actions that we can take. These range from better leveraging existing solutions to exploring new ideas that could help all of us close the gap.
Expand Access to Retirement Savings Plans
The first and most important step toward closing the savings gap is to expand access to retirement plans. Our research clearly demonstrates that access to retirement plans drives participation in these plans. It is the foundational step for American workers to build up their retirement savings. Federal and state policymakers have taken notice and are making tangible progress to expand access. Some states have set up auto‑IRA programs targeting low‑income, high‑turnover industries to provide their employees access and to encourage plan formation. The early signs from states like Oregon and California are encouraging. More workers, often from minority communities, are participating in these plans and saving regularly. But more needs to be done.
Use Plan Design to “Lift All Boats”
Increasing access to retirement plans is not only an issue for policymakers. Employers as plan sponsors can do a lot to make sure that their employees are participating and saving enough in a retirement plan. And they can do so using the different levers of plan design.
The most obvious solution is to adopt auto features such as auto‑enrollment for new employees, auto‑reenrollment for those who previously opted out, and auto‑escalation for everyone, as well as to put savings into a qualified default investment alternative (QDIA). Some plan sponsors may worry about costs, but that doesn’t have to be the case. Sponsors can make other plan design changes to help offset the increased cost of participation. For example, they can change the match percentage, alter the structure of their matching formula, adjust vesting schedules, change the timing of the employer contribution, or move to a different contribution type. Of course, these changes must align with the company’s objectives and the plan sponsor’s fiduciary responsibilities. This is where plan consultants and recordkeepers can help optimize the plan design in aiming to protect the sponsors’ bottom line while promoting better retirement outcomes.
Increase Access to Financial Wellness Programs
Our research shows that many minority savers have competing financial priorities and struggle with things like debt and emergency savings. In recent years, employers have begun to recognize these challenges and to focus on the overall financial health of their employees. Fortunately, workplace financial wellness programs are proliferating. These programs can offer workers solid guidance on managing their competing financial priorities. If more employers offer programs that help participants with things like emergency savings, debt management, and budgeting, it could reduce financial stress and help improve retirement savings outcomes.
Bolster Financial IQs to Improve Behavior
Our research shows that most retirement plan participants rely on their employers to be their primary source of financial guidance. And employers do provide a range of financial education resources to their employees. But more can be done. For example, sponsors can target communications to workers who opt out of auto‑enrollment plans and workers who decide not to participate in opt‑in plans. These communications can illustrate the effects of a late start to saving. Other targeted communications could address participants who’ve lowered their contribution rates. It will be particularly helpful if participants receive these communications at the point when they’re making their decisions.
Improve the Availability of Plan Data
Demographic information is rarely shared with other plan data. This makes it difficult to analyze gaps in retirement preparation among minority retirement plan participants. Privacy concerns are real and understandable. But if these concerns can be resolved and such data becomes more widely available, it will be easier to see if retirement plan benefits are shared broadly and evenly, and the effects of plan design changes on various groups can be measured.
Final Thoughts
Racial inequality in the United States is the result of socioeconomic factors that have been in the making for centuries. Retirement plans cannot escape these forces. They reflect the inequality that is present in our larger society. The problem won’t be solved overnight, and more efforts from every corner of our society are needed to reverse the course of the current trends. Regulated retirement plans that provide easy access to professional investment management should be a part of the solution. Let’s all try our best to make it happen.
Important Information
This material is being furnished for general informational and/or marketing purposes only. The material does not constitute or undertake to give advice of any nature, including fiduciary investment advice. Prospective investors are recommended to seek independent legal, financial and tax advice before making any investment decision. T. Rowe Price group of companies including T. Rowe Price Associates, Inc. and/or its affiliates receive revenue from T. Rowe Price investment products and services. Past performance is no guarantee or a reliable indicator of future results.. The value of an investment and any income from it can go down as well as up. Investors may get back less than the amount invested.
The material does not constitute a distribution, an offer, an invitation, a personal or general recommendation or solicitation to sell or buy any securities in any jurisdiction or to conduct any particular investment activity. The material has not been reviewed by any regulatory authority in any jurisdiction.
Information and opinions presented have been obtained or derived from sources believed to be reliable and current; however, we cannot guarantee the sources’ accuracy or completeness. There is no guarantee that any forecasts made will come to pass. The views contained herein are as of the date written and are subject to change without notice; these views may differ from those of other T. Rowe Price group companies and/or associates. Under no circumstances should the material, in whole or in part, be copied or redistributed without consent from T. Rowe Price.
The material is not intended for use by persons in jurisdictions which prohibit or restrict the distribution of the material and in certain countries the material is provided upon specific request. It is not intended for distribution to retail investors in any jurisdiction.
USA—Issued in the USA by T. Rowe Price Associates, Inc., 100 East Pratt Street, Baltimore, MD, 21202, which is regulated by the U.S. Securities and Exchange Commission. For Institutional Investors only.
© 2024 T. Rowe Price. All Rights Reserved. T. ROWE PRICE, INVEST WITH CONFIDENCE, and the Bighorn Sheep design are, collectively and/or apart, trademarks of T. Rowe Price Group, Inc.
March 2022 / MARKET OUTLOOK
