
13 September 2021 / MULTI-ASSET SOLUTIONS
Looming Lower Returns Demand Creative Multi-Asset Response
Active management and a broad toolkit may be necessary
Key Insights
- Equity and bond markets are expected to deliver lower returns over the next five years than in recent periods. This will impact multi‑asset portfolios.
- One way for multi‑asset investors to boost potential returns is by increasing risk exposure in their portfolios, either between or within asset classes.
- Active management can potentially enhance performance both through dynamic asset allocation across asset classes and through security selection within each asset class.
Investors are often heard to say that “more jam today means less jam tomorrow.” In other words, an asset generating high returns in one period is likely to struggle to deliver continued elevated returns in following periods. Or, to put it another way, a higher price today means lower returns tomorrow. This is particularly the case at the asset class level, where it is difficult for investments to defy the gravitational pull of fundamental factors such as long‑term economic growth, inflation, productivity gains, and demographics indefinitely.
Despite the market turbulence that occurred at the beginning of the coronavirus pandemic, many investments have posted strong overall returns for the past decade. With valuations for key equity and fixed income metrics currently high or even stretched, though, the key question for many investors is: What would now be a reasonable long‑term expected return from a diversified multi‑asset portfolio?
Below, we examine our expectations for such portfolios based on our forward‑looking capital market assumptions and consider how these vary under different potential scenarios. We also consider the options available for investors where their return requirements might now be greater than these expectations.
Capital Markets Assumptions
T. Rowe Price’s capital markets assumptions are produced on an annual basis. The results blend quantitative models and qualitative oversight, leveraging the collective insights of our subject matter experts across the Fixed Income, Equity, and Multi‑Asset Divisions to produce five‑year forecasts in five major base currencies. While there will be significant variation around these assumptions, we believe they give an indication of the central tendency of likely returns to different asset classes.
Lower Asset Class Returns Beckon
(Fig. 1) We believe most areas will likely deliver lower returns than in
the recent past
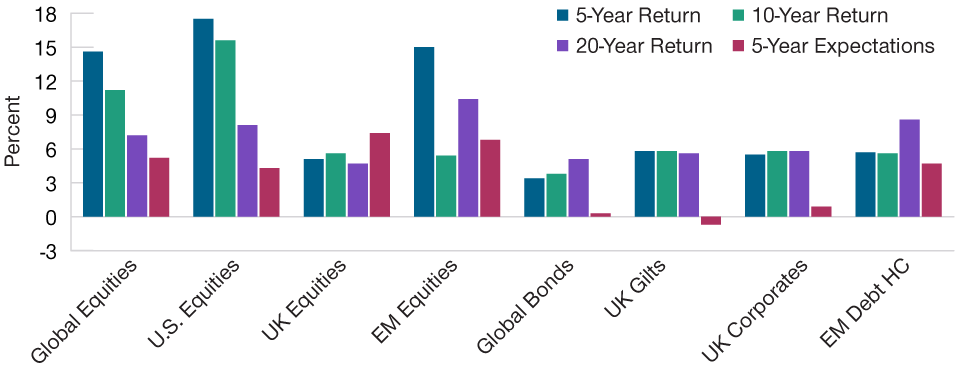
As of December 31, 2020.
Past performance is not a reliable indicator of future results. Actual future outcomes may differ materially from return expectations.
Returns of Global Bonds and EM Debt HC are shown hedged to GBP. EM = Emerging Markets. HC = Hard Currency. Assumptions as of January 2021. See Appendix for a representative list of indexes and additional important disclosure on our capital market assumptions. This information is not intended to be investment advice or a recommendation to take any particular investment action. The forecasts contained herein are for illustrative purposes only and are not indicative of future results. Forecasts are based on subjective estimates about market environments that may never occur and are subject to change.
Sources: T. Rowe Price, MSCI, Bloomberg Barclays, FTSE Russell, J.P. Morgan Chase & Co. (see Additional Disclosures).
We show our current five‑year forecasts1 for a range of asset classes, as well as the realized investment returns for 5‑, 10‑, and 20‑year periods to the end of 2020, in Figure 1.
For most of the asset classes shown, we forecast five‑year returns that are lower than those seen in previous periods—in some cases considerably lower. In fixed income markets, this reflects levels of expected risk‑free rates that are close to historical lows in key markets such as the U.S., Japan, and Germany. We believe yields will likely rise in key government bond markets over the next five years, with higher yields overall, particularly at the long end of the curve. Low rates today and rising yields in the future are likely to result in relatively low positive or negative total returns for many types of bonds.
In equity markets, a positive outlook for earnings growth as economies put the impact of the pandemic behind them is offset by valuation measures that look elevated for many markets. We expect returns in many large markets such as the U.S. to be restrained relative to recent history as a result.
Figure 2 shows the percentile ranking valuation for a range of asset classes as of the end of July 2021 relative to their own history over the previous 15 years. For example, a percentile of 93% for U.S. Treasuries means that 10‑year U.S. Treasury bonds were more expensive as of July 31, 2021, than they were 93% of times over the last 15 years. While valuations across asset classes vary, and some assets are attractively valued, the valuations of most assets are elevated on these measures.
Valuations Are Stretched
(Fig. 2) Valuation percentile rankings versus past 15 years
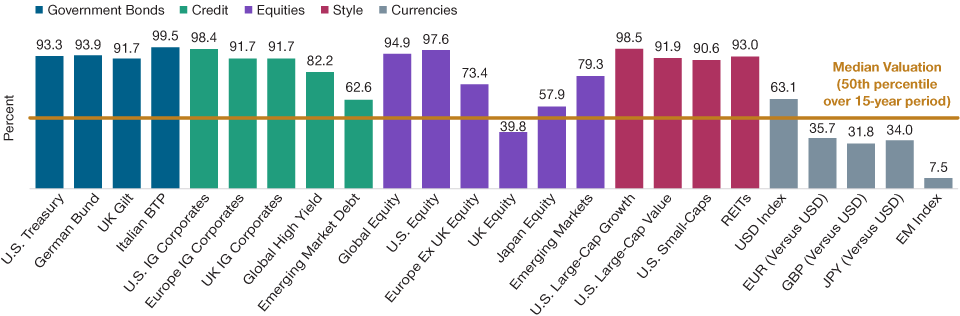
As of July 31, 2021.
For government bonds, the valuation metrics used are 10-Year Benchmark Government Bond Yields. For credit, the metrics used are Option-Adjusted Spreads. For equities and styles, the metrics used are Equal Weighted Average of NTM P/E, P/B, and P/Cash Flow. For currencies, the metrics used are closing FX rates, either versus the US dollar or for the respective index. Indices: U.S. 10‑year Treasury, German 10‑year bund, UK 10‑year gilt, Italian 10‑year BTP, Bloomberg Barclays (BB) US Corporate Aggregate, BB EuroAgg Corporate, BB Global Aggregate Corporate—United Kingdom, BB Global High Yield, BB EM USD Aggregate, MSCI AC World, S&P 500, MSCI Europe ex UK, MSCI UK, MSCI Japan, MSCI EM, Russell 1000 Growth, Russell 1000 Value, Russell 2000, FTSE EPRA/NAREIT Developed, U.S. dollar index, EUR spot, GBP spot, JPY spot, JPM EM currency index.
Sources: T. Rowe Price analysis using data from FactSet Research Systems Inc. All rights reserved. Source for Bloomberg Barclays index data: Bloomberg Index Services Limited, MSCI, Standard & Poor’s (see Additional Disclosures).
Prospective Multi‑Asset Portfolio Returns
Lower return expectations for equity and fixed income clearly also have a knock‑on impact at the multi‑asset portfolio level. In Figure 3, we consider the expected returns for different hypothetical globally diversified mixes of equities and bonds, compared with the actual returns using index data as a proxy that these would have produced over periods to the end of 2020.
Multi‑Asset Portfolios Also Face Lower Returns
(Fig. 3) Five‑year expectations are below those of recent periods
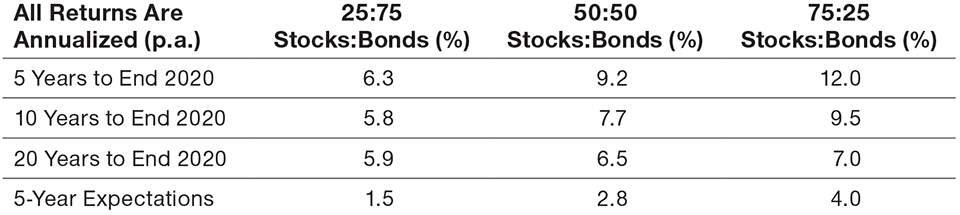
As of December 31, 2020.
Hypothetical performance based on past index results is not a reliable indicator of future results. Actual future outcomes may differ materially from return expectations.
Assumptions as of January 2021. Equities = MSCI ACWI measured in GBP. Bonds = Bloomberg Barclays Global Aggregate Index hedged to GBP. This information is not intended to be investment advice or a recommendation to take any particular investment action. The forecasts contained herein are for illustrative purposes only and are not indicative of future results. Forecasts are based on subjective estimates about market environments that may never occur and are subject to change. Please see Appendix for additional important disclosure on our capital market assumptions and hypothetical portfolios based on index data.
Sources: T. Rowe Price, MSCI, Bloomberg Barclays (see Additional Disclosures).
The returns received from equity and fixed income market exposure in the periods shown historically are well in excess of what we expect over the next five years, based on our capital market assumptions. We do not anticipate the strong returns of the past five years in particular to be matched in the coming periods.
Point estimates of future returns are implicitly accompanied by high levels of uncertainty. For that reason, we construct four additional sets of capital market assumptions that represent bearish, moderately bearish, moderately bullish, and bullish outlooks. These scenarios allow for consideration of a wider range of economic and return conditions. Figure 4 shows estimates of future returns for our three illustrative multi‑asset portfolios under each of these scenarios.
A Strong Bull Market Would Likely Partially Boost Returns
(Fig. 4) The best‑case scenario would still deliver weaker
relative performance
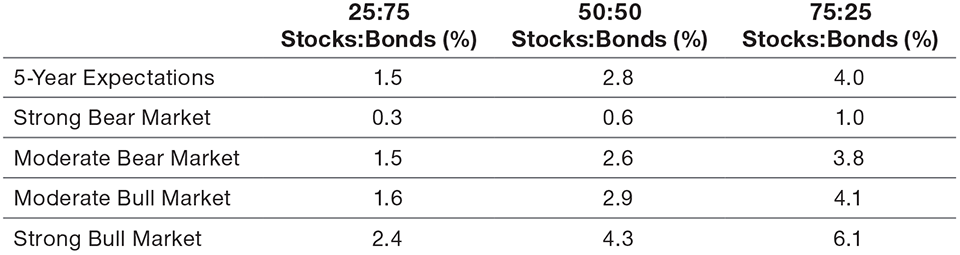
As of January 31, 2021.
Actual future outcomes may differ materially from return expectations.
All of the returns forecast in this table are annualized. Assumptions as of January 2021. Equities = MSCI ACWI measured in GBP. Bonds = Bloomberg Barclays Global Aggregate Index hedged to GBP. This information is not intended to be investment advice or a recommendation to take any particular investment action. The forecasts contained herein are for illustrative purposes only and are not indicative of future results. Forecasts are based on subjective estimates about market environments that may never occur and are subject to change. The scenario generation process begins by analyzing historical periods of differing investor sentiment towards risk. Using global equity returns as a proxy for risk, we divide the past 15 years of common asset class performance into quartiles and estimate the volatility of each asset class and its correlation to global equities during those periods. We then divide the past 30 years of rolling 5-year periods into quartiles and reconstruct the broader set of asset class returns using their previously estimated volatilities and correlations. Please see Appendix for additional important disclosure on our capital market assumptions and hypothetical portfolios based on index data. A complete description of our methodology is available in the published CMA document, Capital Market Assumptions, Five Year Perspective 2021.
Sources: T. Rowe Price, MSCI, Bloomberg Barclays (see Additional Disclosures).
Even in the two more optimistic bull market scenarios, the expected returns on the illustrative multi‑asset portfolios are well below those that investors have experienced in recent periods. For the hypothetical 50:50 multi‑asset portfolio, estimated returns in a strong bull market are calculated as more than 3% less than returns on the same portfolio over 10 years to the end of 2020 and almost 5% less than the returns over the last five years of that period.
What Does This Mean for Investors?
Given that investor expectations for future returns are often based on previous returns, these estimates highlight the likelihood of disappointment if expectations are not tempered by awareness of current market conditions. If a target level of nominal or real returns has been set based on what similar portfolios would have delivered in the recent past, the potential for disappointment is even more acute.
The implications for individual investors could be material. For example, long‑term savers can find themselves without sufficient savings at retirement when relying on overly optimistic expected returns on their investments. We believe such investors should act today, and potentially revise their financial planning, because when retired it may be too late. Without sufficient savings, full retirement at the desired retirement age may not be a viable option.
A simple example shows the impact in monetary terms. A hypothetical savings pot of GBP 100,000 invested in the 50:50 equity:bond portfolio at the end of 2015 would have been worth GBP 155,000 by the end of 2020. Based on our current expectations, a similar hypothetical portfolio would amount to just GBP 114,000 at the end of the next five years—over a quarter less.
What Portfolio Construction Options Are Available?
Possibly the simplest response is to accept that the investment environment has changed and that returns on multi‑asset portfolios are likely to be lower than they have been in the past. For investors, this may mean recalibrating their behavior—reducing spending as a percentage of their portfolio’s value, increasing savings, or pushing back an anticipated retirement date may be valid options for individuals, for example. However, such adjustments may have a significant impact on the individual’s quality of life.
If reducing spending or increasing contributions to a portfolio are not palatable options, it remains to be considered what can be achieved by varying the investment mix within the multi‑asset portfolio.
One way of boosting anticipated long‑term portfolio return is by increasing the level of market risk within the portfolio. Moving from the 50:50 equity:bond portfolio to the 75:25 equity:bond mix, for instance, increases expected return over the five‑year period by more than 1% p.a.
It is also possible to make adjustments within asset classes. For example, an investor might allocate a greater portion of their equity allocation to areas such as emerging market equities and small‑cap companies, which offer current lower relative valuations and potentially higher prospective returns at the cost of higher expected volatility. Such allocations could be on either a strategic or a tactical basis.
Similar adjustments could be made within a fixed income allocation. Our illustrative portfolios are allocated to global investment‑grade bonds, for example, but including exposure to riskier sectors of the fixed income universe, such as high yield or emerging market bonds, would increase expected return due to the higher perceived exposure to credit risk within such assets. It is also possible to extend the duration of fixed income holdings by focusing on longer‑maturity assets. Given that yields are generally higher for longer‑dated bonds, this also increases yield at the cost of higher interest rate risk.
Increasing portfolio risk, however, is not appropriate for every investor. The risk tolerance of some investors is not high enough to accommodate riskier investments—raising the possibility of sleepless nights. Other investors cannot take more risk because their investment horizon is too short. Nevertheless, some investors may consider taking investment risks that are expected to be compensated in a well‑managed and appropriately diversified portfolio.
What Role Could Active Management Play?
Our expected returns are based on returns to markets, meaning they do not account for the potential benefits of active management. In a lower‑return environment, investors may see an increased role for active risk in the pursuit of higher returns. In the current uncertain environment, new trends and creative disruption following the coronavirus pandemic have created a fertile environment for skilled active managers to add value. Active management can potentially enhance performance, through both dynamic asset allocation across asset classes and security selection within each asset class.
A greater focus on manager risk could come via the active management of existing asset holdings or looking to strategies such as alternatives, seeking to generate most or all of their return regardless of market direction and add independent sources of potential return. Active returns from active strategies—or alpha—typically have imperfect correlations with market returns and can therefore add to the diversification of multi‑asset portfolios.
Risk management overlays can mean sharing some of the upside if markets continue to do well and mitigating some of the downside risk if markets retreat. Even for globally diversified equity portfolios, periods of crisis are usually accompanied by a substantial increase in market moves.
Managed volatility risk overlays, for example, aim to maintain equity volatility within a prescribed range. When expected equity volatility rises in this way, the overlay automatically reduces portfolio risk—this should allow investors more confidence in maintaining equity market exposure even when the outlook is uncertain. Investors could also look to set defined triggers in place to “lock in” gains from riskier assets as they arise by reducing exposure in a systematic way when certain targets are hit.
Overall, then, we believe that lower expected market returns ahead mean that many investors will need to become more creative with their portfolios. Taking thoughtful risks, using skilled active management, and deploying less traditional sources of return and risk management techniques are all part of the available toolkit.
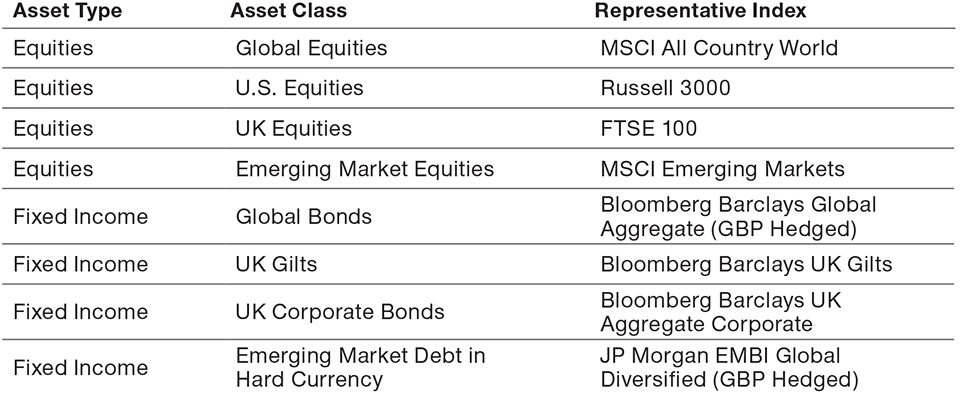
Appendix—Representative Indices
IMPORTANT INFORMATION
This material is being furnished for general informational and/or marketing purposes only. The material does not constitute or undertake to give advice of any nature, including fiduciary investment advice, nor is it intended to serve as the primary basis for an investment decision. Prospective investors are recommended to seek independent legal, financial and tax advice before making any investment decision. T. Rowe Price group of companies including T. Rowe Price Associates, Inc. and/or its affiliates receive revenue from T. Rowe Price investment products and services. Past performance is not a reliable indicator of future performance. The value of an investment and any income from it can go down as well as up. Investors may get back less than the amount invested.
The material does not constitute a distribution, an offer, an invitation, a personal or general recommendation or solicitation to sell or buy any securities in any jurisdiction or to conduct any particular investment activity. The material has not been reviewed by any regulatory authority in any jurisdiction.
Information and opinions presented have been obtained or derived from sources believed to be reliable and current; however, we cannot guarantee the sources’ accuracy or completeness. There is no guarantee that any forecasts made will come to pass. The views contained herein are as of the date noted on the material and are subject to change without notice; these views may differ from those of other T. Rowe Price group companies and/or associates. Under no circumstances should the material, in whole or in part, be copied or redistributed without consent from T. Rowe Price.
The material is not intended for use by persons in jurisdictions which prohibit or restrict the distribution of the material and in certain countries the material is provided upon specific request. It is not intended for distribution to retail investors in any jurisdiction.
September 2021 / MARKETS & ECONOMY
