
July 2022 / INVESTMENT INSIGHTS
Value Has Returned to High Yield
Fundamentals are strong, and spreads are attractive.
Key Insights
- Volatility has pushed high yield bond spreads to extreme levels, but we believe the asset class’s fundamentals are stronger than valuations suggest.
- Recent history has shown that once European high yield spreads have reached more than 600bps, strong returns have typically followed.
- Market prices do not reflect the credit stability enjoyed by many high yield issuers on the back of lower borrowing costs.
Volatility has propelled high yield bond spreads to extreme levels, but we believe the asset class’s fundamentals remain solid, however, and that current valuations do not reflect its underlying strength. This suggests that high yield bonds are cheap by historical standards—and offer a compelling buying opportunity for investors seeking consistent income in the uncertain period ahead.
Anxiety over rising inflation, interest rate hikes, the war in Ukraine, and low growth have sent asset prices tumbling this year, and high yield bonds have been no exception. At the end of June, the effective yield of the ICE BofA Euro High Yield Index had risen to 7.3% from 2.8% at the beginning of the year. Over the same period, the spread on the index had widened from 3.3% to 6.4%.
The Buffer Is Back
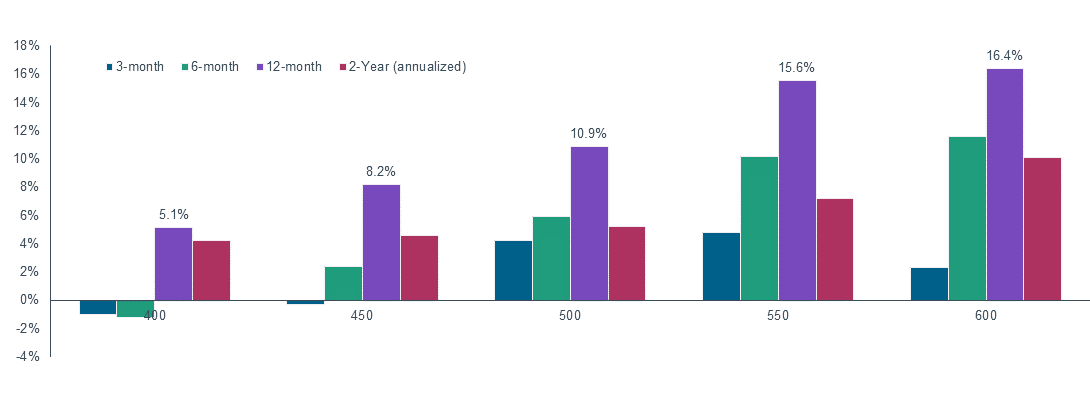
A unique feature of high yield debt is the yield “buffer” that it offers. High coupons should provide consistent and meaningful income, which helps dampen price volatility and has delivered attractive risk‑adjusted returns over time. This year’s jump in yields has meant that this buffer is back again, providing investors with a powerful compounding effect—June’s yield to maturity of 7.58% compared with an average of 4.38% over the past 10 years.1 Recent history has shown that once European high yield bond spreads have reached yield‑to‑worst levels of more than 600bps, strong returns have typically followed in subsequent periods (Figure 1). At the end of June, the spread‑to‑worst of European high yield debt was 644bps.
Performance Has Typically Bounced Back After Lows
(Fig. 1) Strong returns have followed stretched yield‑to‑worst levels
Past performance is not a reliable indicator of future performance.
As of June 30, 2022.
The date range is January 1, 2012 to June 30, 2022. The frequency of calculations is daily.
Source: ICE BoA (see Additional Disclosure). Analysis by T. Rowe Price.
But are these stretched valuations merely reflective of higher expected default rates? It is certainly true that many high yield debt issuers face a difficult operating environment in the period ahead. On the one hand, rising energy, wage, fuel, and supply chain prices are pushing up input costs across the board; on the other, central bank rate hikes are increasing borrowing costs, which will reduce consumer demand—and this may ultimately lead to recession.
Firms facing higher costs and falling demand are at greater risk of default—at the end of June, the market was pricing in a default rate of just under 5% in 12 months’ time. However, the current default rate is just 0.01%. Are the challenges firms face so formidable that the default rate is likely to rise from virtually zero to almost 5% within the next 12 months?
We do not think so. As a result of the refinancing wave of 2020–2021, most firms currently have high levels of cash relative to debt on their balance sheets. They have been able to borrow at very low rates for a long time, enabling them to extend maturities, reduce borrowing costs, and optimize capital structures. Given these positive fundamental factors, we expect a default rate of 1.5% over the next 12 months and 2.5–3% during 2023. JP Morgan is forecasting even lower default rates of 1% over the next 12 months and 2.5% in 2023. Both of these are much lower than the 20‑year average default rate of 3.2% and the 4% priced in by the market.
Markets Are Driven by Fear, Not Fundamentals
In our view, the market is pricing in a much higher default rate because it is being largely driven by macroeconomic fears and is failing to recognize the stability that low borrowing costs brought to many high yield debt issuers. In other words, it is ignoring the fundamentals. Spreads could, of course, rise further—the U.S. Federal Reserve recently surprised everybody by hiking 75bps instead of an expected 50bps. However, even if spreads do widen further, we believe the probability of losing money over the next 12 months remains low. As Figure 1 shows, when spreads have reached 500bps to 550bps over the past 10 years, investors have gained positive average returns over the subsequent three‑month, six‑month, 12‑month, and two‑year time horizons.
While equities are primarily driven by economic growth, high yield bonds are mainly about credit stability. The key questions for investors are whether they will receive their coupons and their principal back and how likely the firm is to default. Because the coupons on high yield bonds contribute a much higher proportion of total returns than dividends contribute for stock returns, the income profile is much smoother. For investors willing to take on a bit of risk in their portfolios, high yield bonds may therefore be a smart choice in the period ahead.
T. Rowe Price cautions that economic estimates and forward-looking statements are subject to numerous assumptions, risks, and uncertainties, which change over time. Actual outcomes could differ materially from those anticipated in estimates and forward‑looking statements, and future results could differ materially from historical performance. Forward-looking statements speak only as of the date they are made, and T. Rowe Price assumes no duty to and does not undertake to update forward-looking statements.
Additional Disclosure
ICE Data Indices, LLC (“ICE DATA”), is used with permission. ICE DATA, ITS AFFILIATES AND THEIR RESPECTIVE THIRD‑PARTY SUPPLIERS DISCLAIM ANY AND ALL WARRANTIES AND REPRESENTATIONS, EXPRESS AND/OR IMPLIED, INCLUDING ANY WARRANTIES OF MERCHANTABILITY OR FITNESS FOR A PARTICULAR PURPOSE OR USE, INCLUDING THE INDICES, INDEX DATA AND ANY DATA INCLUDED IN, RELATED TO, OR DERIVED THEREFROM. NEITHER ICE DATA, ITS AFFILIATES NOR THEIR RESPECTIVE THIRD‑PARTY SUPPLIERS SHALL BE SUBJECT TO ANY DAMAGES OR LIABILITY WITH RESPECT TO THE ADEQUACY, ACCURACY, TIMELINESS OR COMPLETENESS OF THE INDICES OR THE INDEX DATA OR ANY COMPONENT THEREOF, AND THE INDICES AND INDEX DATA AND ALL COMPONENTS THEREOF ARE PROVIDED ON AN “AS IS” BASIS AND YOUR USE IS AT YOUR OWN RISK. ICE DATA, ITS AFFILIATES AND THEIR RESPECTIVE THIRD‑PARTY SUPPLIERS DO NOT SPONSOR, ENDORSE, OR RECOMMEND T. ROWE PRICE OR ANY OF ITS PRODUCTS OR SERVICES.
Important Information:
Where securities are mentioned, the specific securities identified and described are for informational purposes only and do not represent recommendations.
This material is being furnished for general informational purposes only. The material does not constitute or undertake to give advice of any nature, including fiduciary investment advice, nor is it intended to serve as the primary basis for an investment decision. Prospective investors are recommended to seek independent legal, financial and tax advice before making any investment decision. T. Rowe Price group of companies including T. Rowe Price Associates, Inc. and/or its affiliates receive revenue from T. Rowe Price investment products and services. Past performance is not a reliable indicator of future performance. The value of an investment and any income from it can go down as well as up. Investors may get back less than the amount invested.
The material does not constitute a distribution, an offer, an invitation, a personal or general recommendation or solicitation to sell or buy any securities in any jurisdiction or to conduct any particular investment activity. The material has not been reviewed by any regulatory authority in any jurisdiction.
Information and opinions presented have been obtained or derived from sources believed to be reliable and current; however, we cannot guarantee the sources’ accuracy or completeness. There is no guarantee that any forecasts made will come to pass. The views contained herein are as of the date written and are subject to change without notice; these views may differ from those of other T. Rowe Price group companies and/or associates. Under no circumstances should the material, in whole or in part, be copied or redistributed without consent from T. Rowe Price.
The material is not intended for use by persons in jurisdictions which prohibit or restrict the distribution of the material and in certain countries the material is provided upon specific request.
It is not intended for distribution to retail investors in any jurisdiction.
This material is only for investment professionals that are eligible to access the T. Rowe Price Asia Regional Institutional Website. Not for further distribution.
© 2024 T. Rowe Price. All Rights Reserved. T. ROWE PRICE, INVEST WITH CONFIDENCE, and the Bighorn Sheep design are, collectively and/or apart, trademarks of T. Rowe Price Group, Inc.