January 2022 / FIXED INCOME
EM Currencies Can Boost Bond Portfolios Amid Rising Inflation
Currencies of commodity-exporting countries are particularly attractive.
This year’s inflation surge has had multiple causes: easy monetary policy from central banks, coronavirus‑related supply chain disruptions, tensions with Russia over the Nord Stream 2 gas pipeline, and the ensuing rise in energy prices. Annual consumer price index inflation in the U.S. reached 6.2% in November, which was the highest recorded value in more than 30 years (the previous high was 6.3% in 1990). Similarly, eurozone inflation has been trending up and hit a multi‑decade high of 4.9% in December.
These trends have increased the pressure on central banks to tighten monetary policy, which spells trouble for bond investors. At the same time, coronavirus‑related disruptions and uncertainty caused by inflationary trends spell trouble for economic growth. Struggling growth coupled with persistent inflation demands a creative approach to bond portfolio management.
We have previously suggested a few tools that bond investors can considering using in this environment, including holding inflation‑linked bonds, positioning farther out the sovereign yield curve (curve flatteners), allocating credit across regions, and actively managing duration. Now, we would like to add another: allocating to emerging market (EM) currencies. EM currencies, especially of those countries that export lots of commodities (such as Russia and South Africa), have tended to outperform during inflationary periods as they stand to benefit from rising commodity prices and higher growth potential in emerging markets.
Figure 1 shows historical returns of EM currencies during months with rising/falling U.S. inflation expectations and rising/falling U.S. real rates (a key barometer of U.S. economic growth expectations). EM currencies, particularly those of resource‑exporting countries, provided the highest returns during periods with rising inflation expectations and falling real rates (falling U.S. growth expectations). However, they also performed well during periods with rising inflation expectations and rising real rates. This suggests that resource‑exporting EM currencies can improve bond portfolio returns during inflationary periods irrespective of whether real rates are falling or rising.
EM Currencies Have Typically Performed Well in Inflationary Periods
(Fig. 1) How EM currencies performed between January 1, 2000, and November 30, 2021
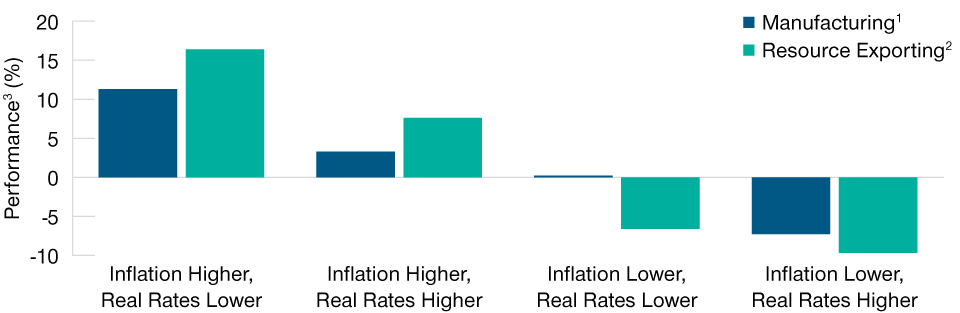
As of November 30, 2021.
Past performance is not a reliable indicator of future performance.
1 Manufacturing represents a basket of six EM countries whose economies include a large contribution from manufacturing activity: China, Poland, Hungary, Indonesia, Malaysia and Thailand.
2 Resource Exporting represents a basket of countries whose economies include a large contribution from resource exports: China, Poland, Hungary, Indonesia, Malaysia and Thailand. Real rates are the rates of U.S. 10‑year inflation protected bonds (TIPS). Inflation expectations are the U.S. 10‑year break‑even rate, which is defined as the difference between U.S. 10‑year nominal bond yield and U.S. 10‑year TIPS yield. The results for each scenario were calculated by examining monthly changes in real rates and break‑even rates in all countries covered over the period. We then bucketed the results into the four scenarios shown.
3 To illustrate how returns were annualized, let’s assume we have three months of monthly returns: 5%, 10%, ‑8%. We first compound these returns as: 1.05 * 1.1 * 0.92 = 1.0626. This figure represents the compound return of those three months. We then annualize this as: 1.0626^(12/3) = 1.2749, which represents an annualized return of 27.49%.
Source: Bloomberg Finance L.P. Analysis by T. Rowe Price.
Figure 2 shows the returns of EM currencies during the period since the onset of Coronavirus—a much smaller, but more recent, sample. It reveals that EM currencies performed their role well during periods with rising inflation expectations and falling growth, which spanned about half the post‑coronavirus period.
Post‑COVID Onset, Rising Real Rates Hampered EM Currency Performance
(Fig. 2) How EM currencies performed between May 1, 2020, and November 30, 2021
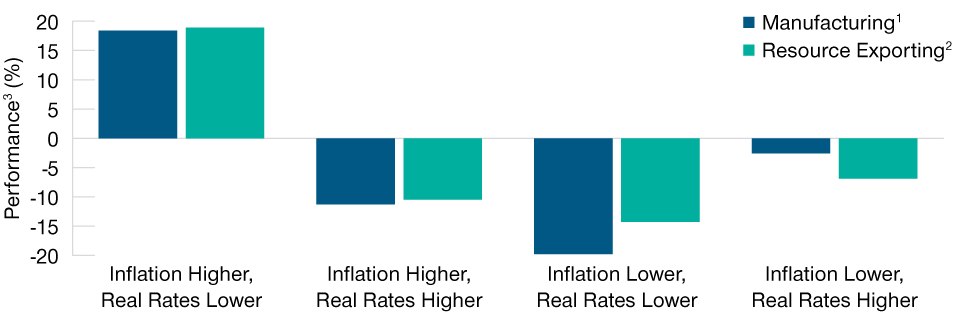
As of November 30, 2021.
Past performance is not a reliable indicator of future performance.
1 See footnote 1 in Fig. 1.
2 See footnote 2 in Fig. 1.
3 See footnote 3 in Fig. 1.
Source: Bloomberg Finance L.P. Analysis by T. Rowe Price.
Crucially, however, it also shows that EMs did not perform as well during inflationary periods with rising real rates. This was likely a reflection of the market’s recent fears around the U.S. Federal Reserve ending the quantitative easing program and starting to hike interest rates, which, if overdone, could cause market‑wide disruptions. However, history suggests that these fears were probably overblown and do not reflect the fundamental advantage of resource‑exporting emerging markets in an inflationary environment.
One final point: Never lose sight of thoughtful portfolio construction. EM currencies tend to behave like “risk on” assets and suffer in a sharp risk‑off environment along with credit. As such, we believe they should be treated as a substitute for credit risk in portfolios—not an enhancement.
IMPORTANT INFORMATION
This material is being furnished for general informational and/or marketing purposes only. The material does not constitute or undertake to give advice of any nature, including fiduciary investment advice, nor is it intended to serve as the primary basis for an investment decision. Prospective investors are recommended to seek independent legal, financial and tax advice before making any investment decision. T. Rowe Price group of companies including T. Rowe Price Associates, Inc. and/or its affiliates receive revenue from T. Rowe Price investment products and services. Past performance is not a reliable indicator of future performance. The value of an investment and any income from it can go down as well as up. Investors may get back less than the amount invested.
The material does not constitute a distribution, an offer, an invitation, a personal or general recommendation or solicitation to sell or buy any securities in any jurisdiction or to conduct any particular investment activity. The material has not been reviewed by any regulatory authority in any jurisdiction.
Information and opinions presented have been obtained or derived from sources believed to be reliable and current; however, we cannot guarantee the sources' accuracy or completeness. There is no guarantee that any forecasts made will come to pass. The views contained herein are as of the date noted on the material and are subject to change without notice; these views may differ from those of other T. Rowe Price group companies and/or associates. Under no circumstances should the material, in whole or in part, be copied or redistributed without consent from T. Rowe Price.
The material is not intended for use by persons in jurisdictions which prohibit or restrict the distribution of the material and in certain countries the material is provided upon specific request.
It is not intended for distribution to retail investors in any jurisdiction.
December 2021 / VIDEO