January 2024 / INVESTMENT INSIGHTS
Is Now the Time to Redeploy Cash?
Historical performance of federal funds interest rate cycle peaks could help investors decide when to reinvest cash
Key Insights
- Market uncertainty and short-term interest rates above 5% have contributed to record assets in money market funds. With all this cash on the sidelines, many investors want to know when to redeploy cash back into the market.
- Our analysis compared the historical impact of investing various asset classes and a balanced 60/40 portfolio of stocks/bonds versus cash at multiple starting points before, at, and after the fed funds interest rate cycle peak.
- Based on history, investing in a diversified 60/40 portfolio slightly before or at the fed funds peak may be optimal, while investing after the peak still outperformed cash.
- Fixed income also outperformed in all periods except one year before the fed funds peak starting point. Equity results were not as clear-cut as fixed income, but investing at the peak generated significantly better returns than cash and bonds.
Ongoing market uncertainty combined with short-term interest rates above 5% have resulted in a record amount of assets moving into money market funds. According to Morningstar, investors held approximately $5.6 trillion in money market accounts as of August 31, 2023, representing an increase of over $1 trillion over the prior 12 months. Based on our client conversations, we have seen a significant rise in cash and cash proxies held in financial models. We are also seeing cash held outside the models, waiting to be redeployed into the market.
Interest rate peaks could be the key to timing cash reinvestment
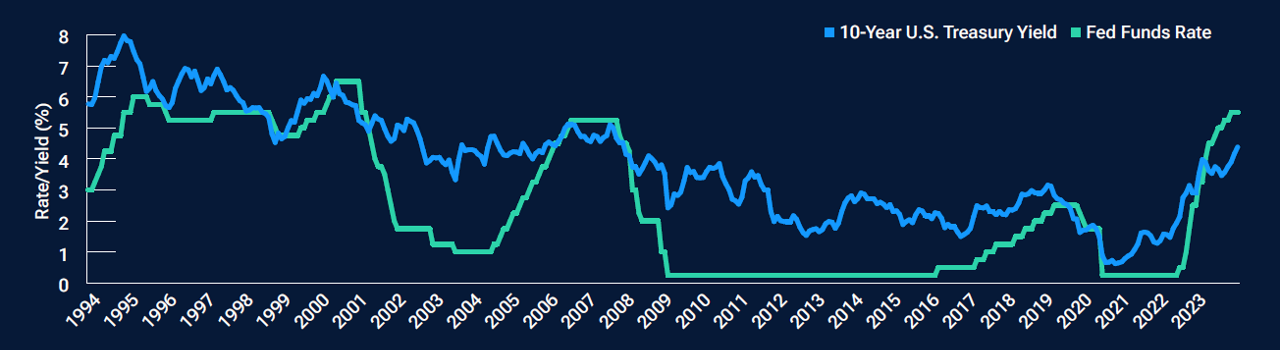
As shown in Figure 1, the federal funds interest rate and the 10-year U.S. Treasury yield historically tended to peak together. However, our research suggests that investors don’t need to wait for the peak to redeploy cash.
The T. Rowe Price Portfolio Construction team analyzed similar historical periods that could help investment professionals make informed decisions on when to redeploy cash back into the markets. Our analysis focused on the average 12-month returns of the past four fed funds interest rate peaks and looked at the impact of investing at various starting points prior to, at, and after the cycle peak.
For the peak interest rate dates, we used February 1995, May 2000, June 2006, and December 2018. We used the 90-day T-bill to proxy cash and cash equivalents in our study, and we compared these returns with a typical moderate-risk portfolio composed of 60% stocks (S&P 500 Index) and 40% bonds (Bloomberg U.S. Aggregate Bond Index), as well as a selection of common fixed income and equity benchmarks.
Fed funds interest rates and Treasury yields tended to peak together
(Fig. 1) Fed funds rate and 10-year U.S. Treasury yield: December 31, 1993, through September 30, 2023
Past performance is not a reliable indicator of future performance. Index performance is for illustrative purposes only and is not indicative of any specific investment. Investors cannot invest directly in an index.
Source: Haver Analytics/Federal Reserve Board. T. Rowe Price analysis using data from FactSet Research Systems, Inc.
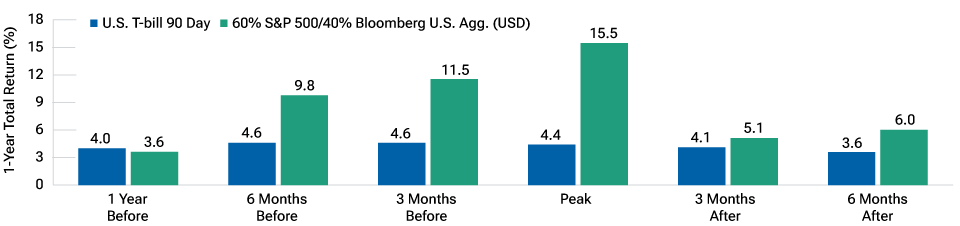
As shown in Figure 2, a balanced 60/40 portfolio underperformed the cash proxy when invested one year prior to the fed funds peak. The stock component performed relatively well during this period, but the bond component lagged as interest rates were still rising. The balanced portfolio outperformed the U.S. 90-Day Treasury bill cash proxy at all other starting points. The outperformance was greatest when invested at the peak, followed by the three- and six-month pre-peak starting points, respectively. Outperformance was smaller after the peak.
A 60/40 portfolio outperformed in all periods except one year before the fed funds peak
(Fig. 2) Average one-year total return of 60/40 portfolio over prior four fed rate hike cycle
Past performance is not a reliable indicator of future performance. Index performance is for illustrative purposes only and is not indicative of any specific investment. Investors cannot invest directly in an index.
Sources: Morningstar, Standard & Poor’s, and Bloomberg. See Additional Disclosures.
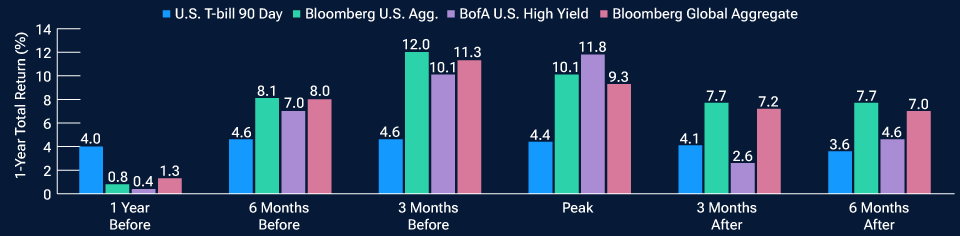
As shown in Figure 3, the pattern among fixed income portfolios is clear: Redeploying cash three and six months prior to the peak, at the peak, and after the peak significantly outperformed the cash proxy. Investing too early—one year prior to the peak—was less than optimal as the cash proxy outperformed. The best outcome occurred when deploying cash six or three months before the peak as longer-duration fixed income significantly outperformed cash as the peak approached. A global fixed income portfolio followed a similar path as U.S. fixed income, while the performance of high yield was mixed.
Fixed income also outperformed in all periods except one year before the fed funds peak
(Fig. 3) Average one-year fixed income total return over prior four fed rate hike cycles
Past performance is not a reliable indicator of future performance. Index performance is for illustrative purposes only and is not indicative of any specific investment. Investors cannot invest directly in an index.
Sources: Morningstar, Bloomberg, and Bank of America. See Additional Disclosures.
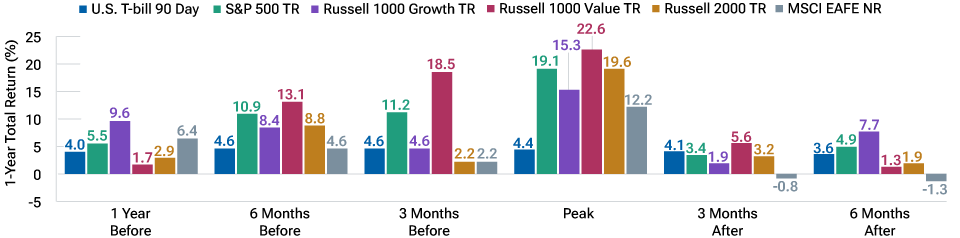
As shown in Figure 4, equity performance was not as clear-cut as fixed income, but there are some important observations. Investing in equities prior to the peak generally outperformed cash, while investing after was less beneficial. The S&P 500 Index and Russell 1000 Growth Index outperformed in all time periods except the period starting three months after the peak. The Russell 1000 Value Index significantly outperformed from six months before to three months after the peak. The performance of small-caps and international equities was mixed.
Equity investments generally outperformed when invested at the fed funds peak
(Fig. 4) Average one-year equity total returns over prior four fed rate hike cycles
Past performance is not a reliable indicator of future performance. Index performance is for illustrative purposes only and is not indicative of any specific investment. Investors cannot invest directly in an index.
Sources: Morningstar, Standard & Poor’s, and Russell. See Additional Disclosures.
Opportunity costs could favor stocks and bonds over cash
There are several compelling reasons to allocate money in cash-equivalent investments, including enhanced liquidity, low volatility, and the current high interest rates. However, there are also reasons to consider redeploying excess cash as we may be nearing a point at which opportunity costs begin to favor stocks and bonds. If the belief is that we are at—or close to—a peak in the fed funds rate, history shows us that investing in a diversified 60/40 portfolio slightly before or at the fed funds peak may be optimal, while investing after the peak still outperformed cash.
IMPORTANT INFORMATION
This material is being furnished for general informational and/or marketing purposes only. The material does not constitute or undertake to give advice of any nature, including fiduciary investment advice, nor is it intended to serve as the primary basis for an investment decision. Prospective investors are recommended to seek independent legal, financial and tax advice before making any investment decision. T. Rowe Price group of companies including T. Rowe Price Associates, Inc. and/or its affiliates receive revenue from T. Rowe Price investment products and services. Past performance is not a reliable indicator of future performance. The value of an investment and any income from it can go down as well as up. Investors may get back less than the amount invested.
The material does not constitute a distribution, an offer, an invitation, a personal or general recommendation or solicitation to sell or buy any securities in any jurisdiction or to conduct any particular investment activity. The material has not been reviewed by any regulatory authority in any jurisdiction.
Information and opinions presented have been obtained or derived from sources believed to be reliable and current; however, we cannot guarantee the sources' accuracy or completeness. There is no guarantee that any forecasts made will come to pass. The views contained herein are as of the date noted on the material and are subject to change without notice; these views may differ from those of other T. Rowe Price group companies and/or associates. Under no circumstances should the material, in whole or in part, be copied or redistributed without consent from T. Rowe Price.
The material is not intended for use by persons in jurisdictions which prohibit or restrict the distribution of the material and in certain countries the material is provided upon specific request.
It is not intended for distribution to retail investors in any jurisdiction.