

Correlation Study: “Attitudes towards Europe and emerging equities are once more utterly divergent."
We have in the past looked at the correlation between people’s attitude to GEM equities and European equities. It was so interesting last time that we thought it was time to do an update.
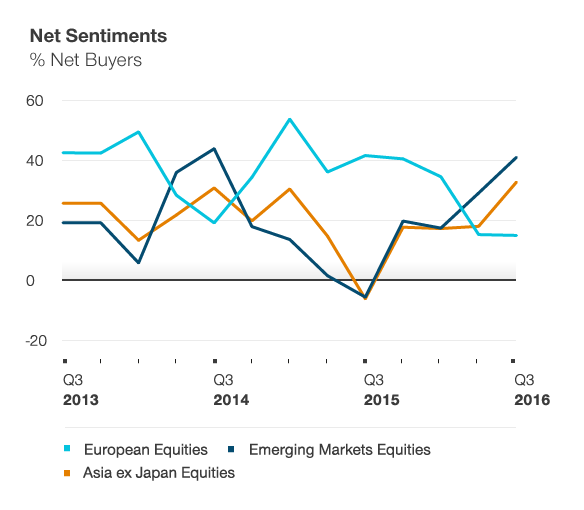
– The top graph shows net sentiment numbers: zero means that the number of those wanting to buy is exactly matched by the number of sellers; a positive number means that there are more buyers; negative means more sellers.
– It compares the net sentiment of European fund selectors to Europe, GEM and Asia ex Japan equities. As you can probably see, for quite a lot of the time, when demand for Europe goes up, demand for GEM and Asia goes down and vice versa. There has been a fairly consistent negative correlation.
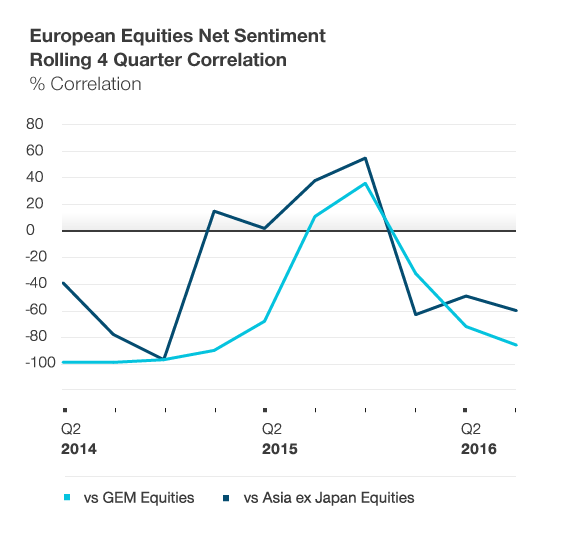
– We use the term ‘fairly consistent’ carefully, however, because it does change over time. The graph underneath shows the correlation between GEM and Asia to European equities: 100 means perfect correlation, -100 perfectly negative and zero means no discernable pattern at all.
– As you can see in 2015, EM and Europe reversed their negative correlations and became a little bit correlated – never more than 60% but nonetheless it was positive. Since the start of 2016, however, it has all reverted and now attitudes towards Europe and emerging equities are once more utterly divergent.
重要資訊
本文件(包括其中所載的任何陳述、資訊、數據和內容)以及與本文件一併提供的任何資料、資訊、圖像、連結、聲音、圖像或視頻(統稱為「資料」)乃由普信提供,並僅作一般資訊用途。本資料並不擬供在禁止或限制分發本資料的司法管轄區和在本資料須按特定要求提供的若干國家之人士使用。本資料不擬派發予任何司法管轄區的散戶投資者。在任何情況下,本資料的全部或部分內容均不得在未經普信同意下複製或再分發或出示予任何人士。本資料並不構成於任何司法管轄區分銷、要約、邀請、建議或徵求發售或購買任何證券。本資料並未經由任何司法管轄區的任何監管機關審閱。本資料並不構成任何投資意見,不得加以依賴。投資者務請在作出任何投資決策前先尋求獨立法律和財務意見(包括有關稅務後果的意見)。
