

Seeking Traditional Fixed Income Qualities in a Non-Traditional Way
Executive Summary
- The traditional benchmark-based approach to fixed income investing – exemplified by the Barclays Global Aggregate Index – has been very successful in delivering the three main qualities investors seek from bonds: income, downside risk management and diversification from equities.
- However, in recent years coupons and yields have fallen to very low levels and the correlation between equities and bonds has risen, meaning that benchmark-based bond investing is very unlikely to deliver the same qualities in the future.
- This does not mean we have to give up seeking these qualities from our fixed income portfolios. However, achieving them will require an unconstrained approach to bond investing, incorporating the full spectrum of the fixed income universe, including government bonds and credit, and countries that are less correlated to major markets.
- One way to accomplish this is to divide the fixed income allocation into three core components: return seeking positions, core stable positions and defensive positions. A portfolio managed in this way can provide stable predictable income, downside risk management and diversification from equity markets.
The traditional benchmark-based approach to fixed income has been popular for a reason: it has worked. But the upheavals that have taken place in the global economy over the past few years, and their subsequent impact on bond markets, have raised serious doubts about whether the traditional approach will continue to work as well in future. Is it time to try something else?
Let’s first focus on what we mean by the ‘traditional’ approach to fixed income. Investors have typically looked for their bond allocation to achieve three things: income, downside risk management and diversification from equities. Income is provided by the coupon on the bond, and is the most certain source of return as it is a contractual obligation. Protection against the downside cannot be guaranteed because there will always be risk, but any losses should be infrequent and limited in size – nasty surprises should hopefully be avoided. Diversification from equities is vital as arguably the main reason investors buy bonds is to derive positive returns when equity markets suffer losses.
In the past, an investor looking for these three qualities from their fixed income portfolio would probably have found themselves a large, broad global index and hired a manager to manage against that. The Barclays Global Aggregate Index1 (“Barclays Agg”) is one of the most widely used indices and has a very rich history, having been established more than 26 years ago. It comprises around 54% global government bonds and 18% corporate bonds, with the remainder split by government-related and securitized products. Geographically, it has 41% exposure to the US, 32% exposure to Europe and 20% exposure to Asia Pacific.2
THE BARCLAYS AGG SUCCESS STORY
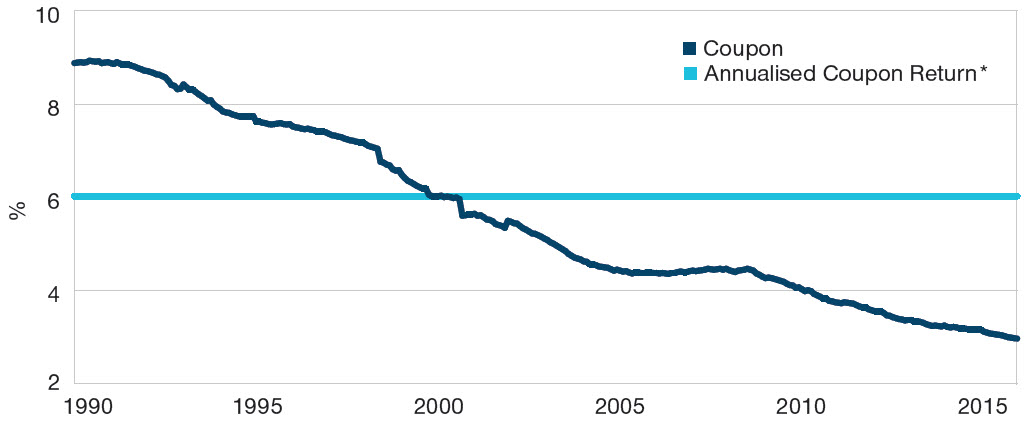
How successfully has the Barclays Agg delivered the traditional qualities sought by investors since the financial crisis of 2008? As Figure 1 shows, income from coupons has declined steadily over the past 26 years, from around 9% to just under 3%, as yields have fallen. However, the annualised return from coupons over that period was 6.02%, with volatility of just 52 basis points – an excellent return for very little volatility. So in terms of providing income, the Barclays Agg has done a very good job.
Figure 1: Barclays Aggregate coupon rate and annualised return, 1990-2015
Past performance is not a reliable indicator of future performance.
*Annualised coupon return assuming reinvestment.
Source: Barclays Capital. Data from Jan-1990 to Dec-2015. Returns hedged to U.S. dollars.
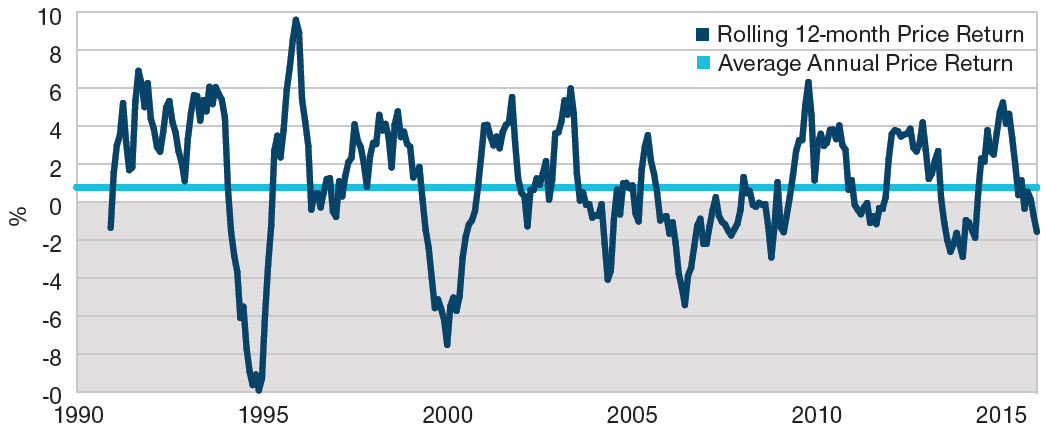
When considering downside management, we look at the changes in price, which derives from changes in yield combined with the amount of duration (price sensitivity to changes in interest rates) in the portfolio. Figure 2 shows that the annual price return from the Barclays Agg has been highly volatile, frequently dipping into negative territory, and sometimes severely so. Annualised over 26 years, the price of the index has delivered a very modest return of 0.8% but with a volatility of 3% – the opposite of the coupon element. What this tells us is that over the long term the coupon has often done much of the heavy lifting in bond portfolios – and therefore should not be dismissed.
Figure 2: Barclays Aggregate annual price return, 1990-2015
Past performance is not a reliable indicator of future performance.
Source: Barclays Capital. Data from Jan-1990 to Dec-2015. Returns hedged to U.S. dollars.
When coupon and price returns are added together, the result is an annualised total return of 6.2% over 26 years, with volatility of 3%. Over that time, periods of negative return were infrequent, the worst being -3.6% in 1994 and the others very small. So when tested against its ability to offer downside protection, the Barclays Agg has performed very well for the past quarter of a century, largely because of the stable cushion of coupon income over that time.
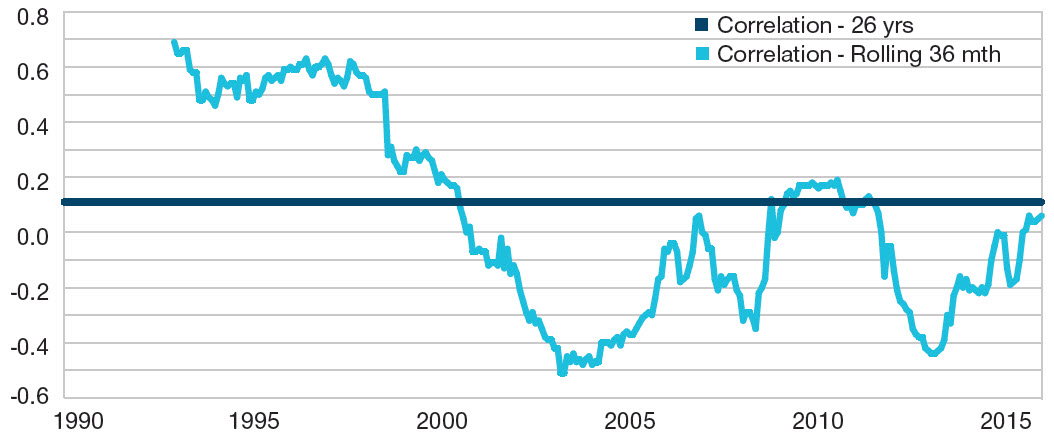
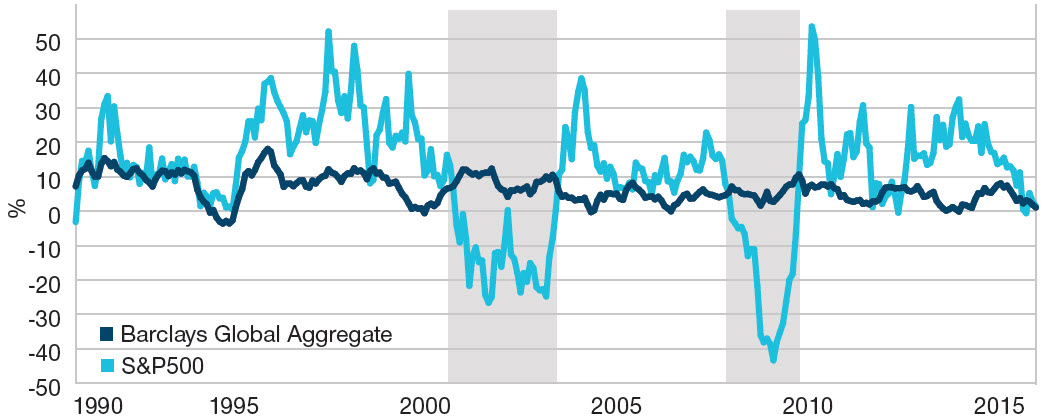
Coming finally to diversification from equities, Figure 3 shows that the correlation of the Barclays Agg to the S&P 500 has averaged out at just 0.1 over 26 years. This does not tell the whole story: as the light blue line in the chart shows, the rolling three-year correlation has ranged from almost 0.7 to -0.5 over that period, indicating the extent to which correlations can change over time. However, as Figure 4 shows, the Barclays Agg has delivered positive returns during two periods of severe falls in equities. The first of those was between October 2000 and May 2003, when it delivered 24.4% during a period in which the S&P 500 declined -29.9%; the second came between December 2007 to September 2009, when the S&P 500 suffered another heavy loss of -24.9% and the Barclays Agg returned 10.6%. So despite varying correlations over time, the Barclays Agg has delivered diversification when it truly mattered – in periods when equities have fallen.
Figure 3: Barclays Global Aggregate total return correlation with S&P 500, 1990-2015
Past performance is not a reliable indicator of future performance.
Source: FactSet, Barclays Capital. Data from Dec-1992 to Dec-2015. Returns hedged to U.S. dollars.
Figure 4: Rolling 12-month return of Barclays Global Aggregate, 1990-2015
Past performance is not a reliable indicator of future performance.
Sources: FactSet, Barclays Capital. Data from Jan-1990 to Dec-2015. Returns hedged to U.S. dollars.
NOTHING LASTS FOREVER…
It is clear that the Barclays Agg has done a very good job of delivering the three main qualities that investors require from bond portfolios over a long period of time. Can we be confident that it will continue to do so in the future? Regarding income, the answer is relatively easy: no. While the coupon return averaged 6.02% over 26 years, at the end of last year it stood at 2.96% – less than half its historical average. Clearly, coupons cannot be expected to deliver the same level of returns as they have done historically.
Let’s now consider downside risk management. From 1990 to 2015, the yield of the Barclays Agg fell from 9.0% to 1.8%, while its duration rose from 3.5 years to 6.6 years. What would happen if we took today’s Barclays Agg, with its record high duration and record low yield, reset it from 1990 and rolled it through the same path of yields that we’ve seen over the past 26 years to estimate overall returns over the next 26? The result is shown in Figure 5, where the light blue line shows the actual returns over that period and the dark blue line represents our historical simulation. It is immediately noticeable that our simulation contains many more months of negative returns than the historical returns over that period.
Figure 5: Barclays Global Aggregats total return, actual and historical simulation
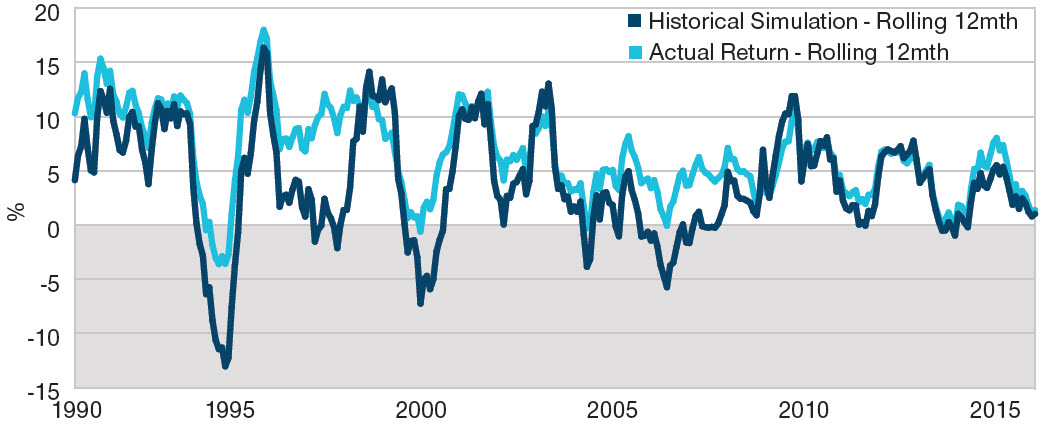
Trailing 12-month total returns since January 1990

Past performance is not a reliable indicator of future performance.
Sources: FactSet, Barclays Capital. Data from Jan-1990 to Dec-2015. Returns hedged to U.S. dollars.
To be precise, there were 11 actual months of negative returns over the 26 years from 1990-2015, but this rises to 62 in our simulation – a frequency of 20.7%, or one in every five months. Moreover, the severity of the negative months is greater in our simulation – an average of -3.0% (compared to -1.8% in the actual period) and a worst negative of -13.04% (compared to -3.6%). Given this, it is clear that the Barclays Agg will not be able to protect against the downside as well in the near-to-medium term as it has done in the past.
As discussed above, the Barclays Agg provided excellent diversification from equities during two distinct periods of equity market collapse over the 26-year period – from October 2000 to May 2003, and from December 2007 to September 2009. It was able to do this because yields were so high that they had ample room to fall, pushing bond prices higher and driving the Barclays Agg to deliver positive returns of 24.4% and 10.6% respectively.
Could today’s bond market deliver those kind of returns? As shown in Figure 6, in order to do so in the first period, the yield would have to fall by 300 basis points from its current 1.77% to -1.23%. In other words, the entire Barclays Agg – all 17,000 securities in 37 countries – would on average have to trade at a negative yield of -1.23% – not impossible perhaps, but highly unlikely. In the second period, the yield would have to fall by 114 basis points from 1.77% to 0.63% – a less dramatic fall, but also an unlikely one. The point here is that negative correlations alone are not enough: there needs to be enough scope for the yields to fall in order to drive prices higher and offset equity market losses. As yields are already at record lows, we have quite simply run out of room for this to occur, meaning the Barclays Agg is very unlikely to deliver the required diversification from equities in the future.
Figure 6: Barclays Aggregate actual yield and simulated required yield path
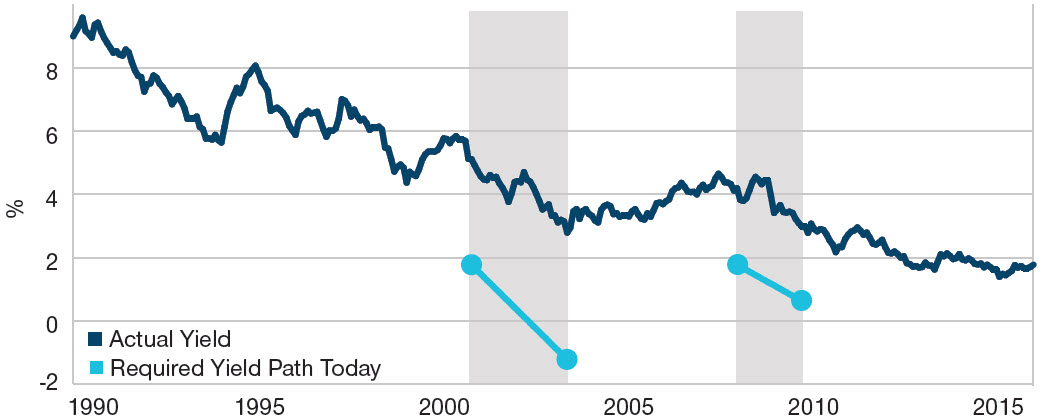
Past performance is not a reliable indicator of future performance.
Sources: FactSet, Barclays Capital. Data from Jan-1990 to Dec-2015. Returns hedged to U.S. dollars.
LOOSENING THE BONDS
In summary, the Barclays Agg is simply no longer able to do as good a job as it has in the past of delivering income, downside risk management and diversification from equities. This does not mean we have to give up seeking these qualities from our fixed income portfolios – they are the reasons we buy bonds and we should continue to strive to achieve them. Doing so, however, will require adopting an unconstrained approach to bond investing – one that considers the full spectrum of the fixed income universe, including government bonds and credit instruments, and countries that are less correlated to major markets.
The good news is that fixed income investors today have more choice than ever before. In countries where interest rates are rising, for example, steepening yield curves can offer income opportunities, while rising volatility on foreign exchange markets can lead to currency opportunities. Emerging markets can offer the higher yields that investors look for but may come with added risk, while lower-yielding, less risky securities still offer benefits in a period of highly volatile equity markets.
The bad news is that greater choice does not necessarily make the job of fixed income investors any easier, however – with more options comes the need for more research, due diligence, and risk management. However, investors who actively embrace this wider opportunity set are ultimately likely to find their efforts rewarded, while those who do not seek access to different country bond markets could miss potential performance enhancement and diversification.
DIVERGENCE CREATES OPPORTUNITY
Policy divergence among central banks across the world is expanding the opportunity set for investors seeking more diversification from their bond portfolios. Those with access to a broad range of markets can derive returns by taking positions in countries at differing stages of the interest rate cycle. Figure 7 illustrates the interest rate cycle of a selected number of developed and emerging markets. It shows how an investor can take advantage of relative country exposures in markets where interest rates are falling or stable versus countries where interest rates are rising.
Figure 7: Illustrative interest rate cycle
As of December 2015
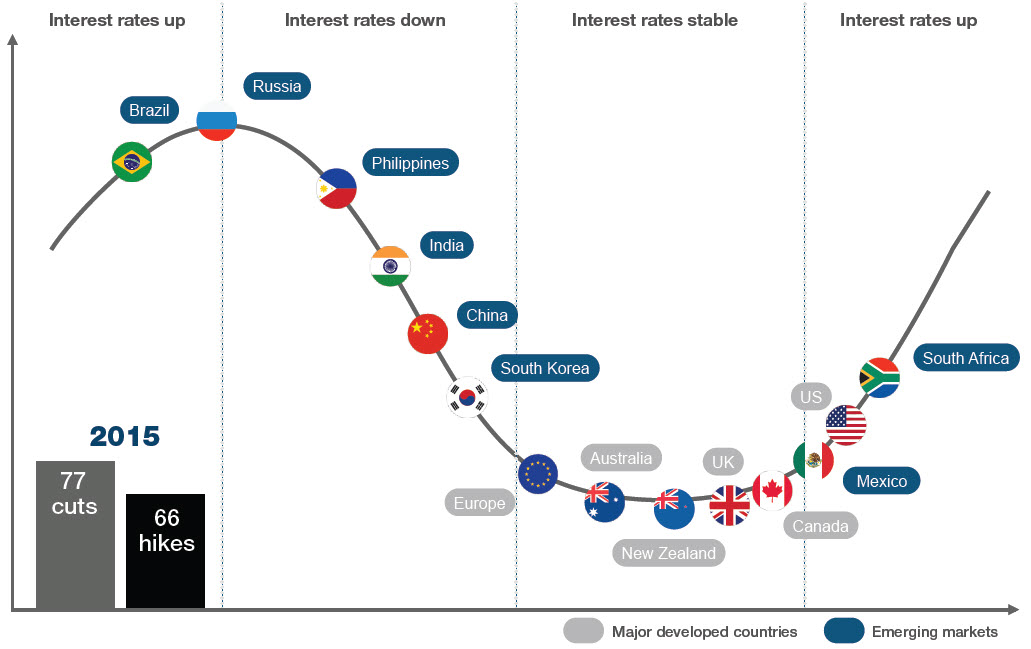
The two columns of cuts vs hikes are the actual cuts and hikes that occurred in 2015 across countries worldwide.
Sources: CRB Rates and T. Rowe Price.
This enables investors to not only exploit interest rate differentials between countries, but also adjust duration and yield curve exposures within individual countries. If yields are attractive but currency valuations are not, currency risk can be neutralised to focus exclusively on country selection.
The ability to capture returns in rising and falling markets through both long and short positions is a key component of the unconstrained approach. During the 30-year bond bull market, investors in traditional long-only fixed income strategies linked to benchmarks such as the Barclays Agg Index enjoyed relatively strong positive returns as yields fell and prices rose. However, as yields begin to rise again and prices fall, the ability to short certain markets and sectors and capture returns from falling prices will be extremely valuable.
By adopting an unconstrained bond strategy, an investor can seek value anywhere in the world irrespective of whether markets are going up or down. But this is not an easy strategy to adopt: the heterogeneous nature of the global bond universe means that the choices facing an unconstrained investor are seemingly endless. Success requires conviction – only those positions backed up with a high degree of confidence should be adopted.
This requires an in-depth analysis of the main macroeconomic indicators, such as economic growth, monetary policy developments, and inflation expectations, and an understanding of the impact these factors have on interest rates in the long term. Armed with this knowledge, investors can compare their expectations with the market consensus and identify where the best opportunities lie, both on the long and the short side.
GOING UNCONSTRAINED DOES NOT MEAN SACRIFICING QUALITY
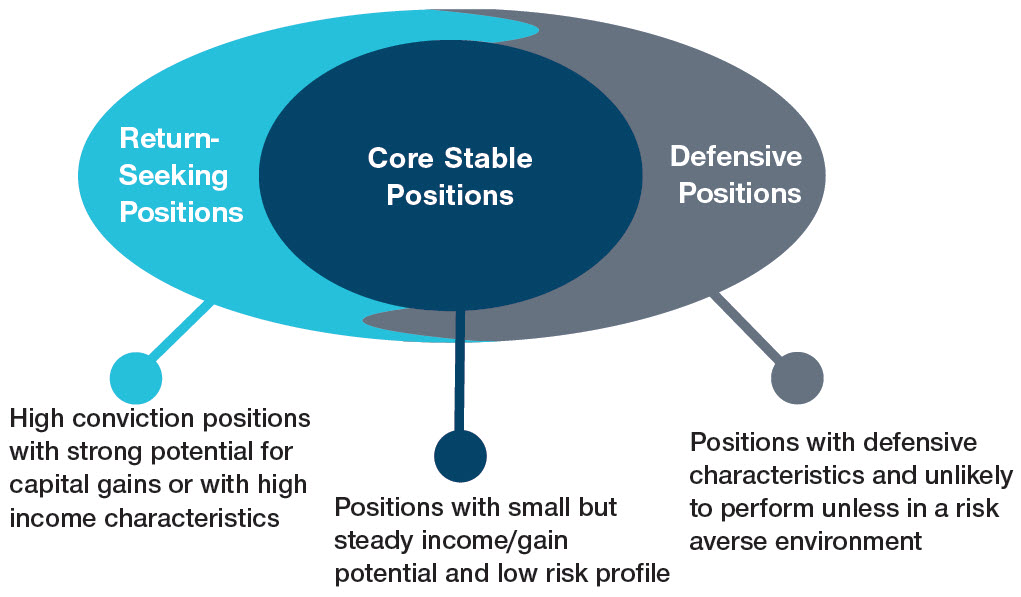
One way to accomplish this is to divide the fixed income allocation into three core components: return seeking positions, core stable positions and defensive positions (see Figure 8). Return-seeking positions include high conviction investments that have strong potential for capital gains or high income characteristics.
Figure 8: The core components of an unconstrained portfolio
Source: T. Rowe Price
They may include locally-denominated emerging market debt and selected high yield products. Core stable positions are those with small but steady income or upside potential and a low risk profile, and may also include long positions in locally-denominated debt as well as shorter-dated investment grade corporate products. Defensive positions are typically those that are unlikely to perform unless in a risk-averse environment, such as inflation-linked products and short positions in vulnerable currencies and sectors.
A portfolio managed in this way can provide a number of benefits to investors, including stable predictable income, downside protection, capital preservation and diversification to equity markets. An unconstrained approach to fixed income is the best way to achieve this – investors should be prepared for the unexpected and able to react quickly to changing circumstances, which means investing across markets and different types of bonds, on both the long and short side. In a world of multi-speed economic growth and differing interest rate cycles, the ability to shift positions quickly can make a huge difference to performance.
It is important to stress that adopting an unconstrained approach need not come at the expense of quality or bring additional transaction costs – it is possible to retain a high-quality, liquid profile while still being agile enough to manage risks. A fixed income strategy that is not constrained by a benchmark, but still contains the best investment ideas, should fulfill fixed income’s role as a diversifier and a provider of sustainable income and capital preservation. Ultimately, the goal is balance: how to find the right mix between duration, country allocation, bottom-up security selection, and currency preservation to achieve optimal returns while effectively managing risk and protecting the portfolio.
1 Index referred to is Barclays Global Aggregate (USD Hedged) Index.
2 As at 15 April 2016. Source: Barclays Global Aggregate Index.
2016-GL-3824
重要資訊
本文件(包括其中所載的任何陳述、資訊、數據和內容)以及與本文件一併提供的任何資料、資訊、圖像、連結、聲音、圖像或視頻(統稱為「資料」)乃由普信提供,並僅作一般資訊用途。本資料並不擬供在禁止或限制分發本資料的司法管轄區和在本資料須按特定要求提供的若干國家之人士使用。本資料不擬派發予任何司法管轄區的散戶投資者。在任何情況下,本資料的全部或部分內容均不得在未經普信同意下複製或再分發或出示予任何人士。本資料並不構成於任何司法管轄區分銷、要約、邀請、建議或徵求發售或購買任何證券。本資料並未經由任何司法管轄區的任何監管機關審閱。本資料並不構成任何投資意見,不得加以依賴。投資者務請在作出任何投資決策前先尋求獨立法律和財務意見(包括有關稅務後果的意見)。

