

Fixed Income: Where is Safety?
Executive Summary
An increasingly correlated bond market means new strategies are needed.
Bond market sectors are becoming increasingly correlated—and this is bad news for fixed income investors seeking to manage risk through sector diversification. In the past, different types of bond sectors—such as Treasuries and credit—have displayed low correlation to each other, making it possible to diversify by investing across them. In recent years, however, some bond instruments have moved increasingly in tandem, significantly reducing their diversification benefits.
Rising correlations mean that investors seeking diversification within their fixed income portfolios will need to reach more widely and deeply across the bond universe to find products that continue to move independently of each other. In effect, this will mean abandoning tried-and-tested strategies in favour of bolder approaches that embrace sectors and instruments which may have previously been considered too risky or unconventional. How investors go about meeting this challenge will go a long way to determining how successful they are in navigating the difficult investment environment of the next few years.
HIDDEN PATTERNS
It is not immediately obvious from a cursory glance at correlation data that bond markets are becoming increasingly positively correlated—a standard matrix of correlations would reveal a mixed picture, with no clear patterns. However, if we look at how correlations have changed over time, a different picture emerges.
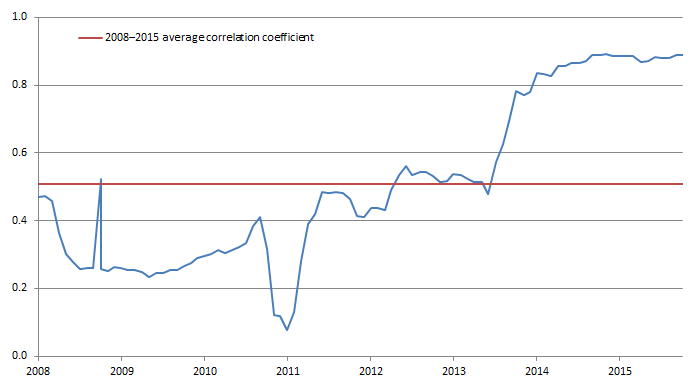
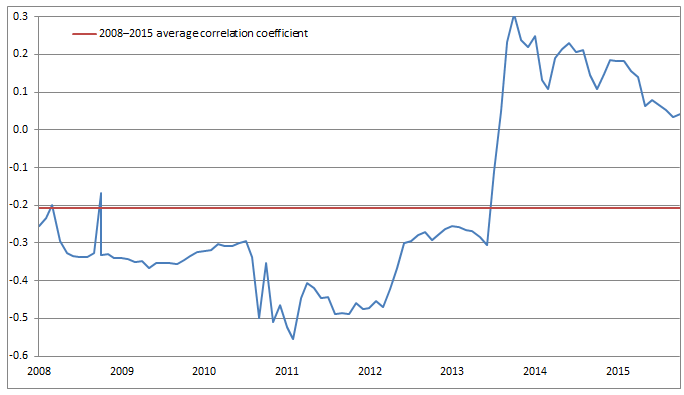
Figure 1, for example, tracks the relationship between U.S. Treasuries and U.S. investment-grade corporates from March 2008 to September 2015, using monthly return correlations over a three-year time horizon. It shows that correlation between U.S. Treasuries and U.S. corporates was less than 0.5 in March 2008 and then fell to below 0.1 in March 2011 before beginning to rise sharply in 2013. It currently stands at just under 0.9—almost perfectly correlated. The correlation between Treasuries and U.S. high yield bonds is much lower, but Figure 2 shows that it also spiked significantly in 2013 from around -0.3 to 0.3 before settling back to its current level of around zero.
FIGURE 1: U.S. Treasuries vs. U.S. Investment-Grade Credit, 2008–2015
Sources: Barclays and T. Rowe Price.
FIGURE 2: U.S. Treasuries vs. U.S. High Yield Bonds, 2008–2015
Sources: Barclays and T. Rowe Price.
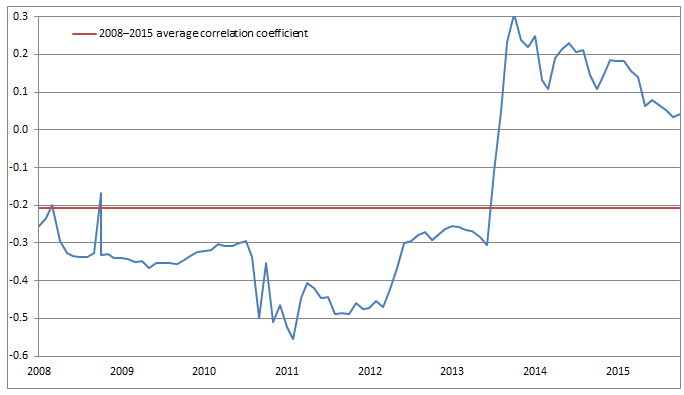
And it is not just in the U.S. that correlations between sovereign bonds and credit are rising. The pattern is the same in Europe, where the correlation between government bonds and investment-grade credit also spiked dramatically in the autumn of 2013 before settling at its current level of just over 0.8 (Figure 3). The correlation between European government bonds and European high yield bonds also rose dramatically in 2013, but it has since fallen back to around -0.3.
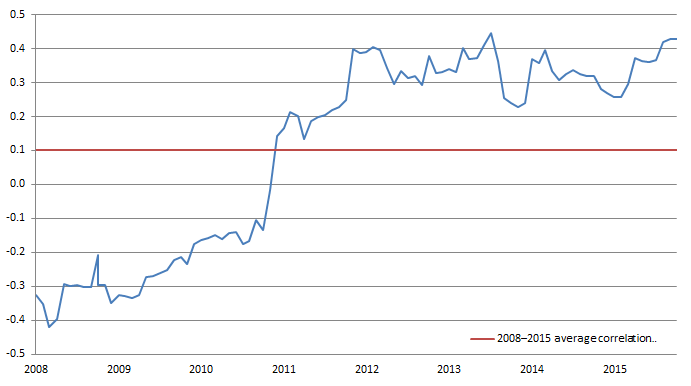
What’s more, rising correlations are not just confined to different types of bond instruments: Correlation levels between bonds and currencies are also rising. Figure 4 shows the relationship between U.S. Treasuries and the U.S. dollar index over the same time period explored above. It reveals that the correlation between the two rose from -0.4 in 2008 to more than 0.4 in October last year. The relationship between U.S. corporates and the U.S. dollar reveals a broadly similar pattern, with the correlation rising from around -0.5 in 2008 to 0.3 by October 2015. In Europe, the correlation between the euro and European sovereign bonds rose from zero at the beginning of 2013 to 0.5 in September last year.
QE WIPES OUT DIFFERENTIATION
The primary reason for rising correlations over the past few years is that central bank quantitative easing (QE) programs have tightened credit spreads to such an extent that quality differentiation has been all but lost. The yield on a corporate bond comprises two parts: the risk-free element and the credit premium (the extra return available for additional risk). When central banks purchased large numbers of government bonds through quantitative easing programs, they effectively squeezed private investors out of the sovereign market, forcing them to purchase larger quantities of riskier credit debt in their search for yield. The subsequent surge in demand for corporate bonds pushed spreads between credit and Treasuries down to very low levels, effectively removing the credit premium and sending correlations between Treasuries and credit surging higher.
FIGURE 3: European Government Bonds vs. European Investment-Grade Credit, 2008–2015
Sources: Barclays and T. Rowe Price.Past performance is not a reliable indicator of future performance.
FIGURE 4: U.S. Treasuries vs. DXY Index, 2008–2015
Sources: Barclays and T. Rowe Price.
It is evident from the data that the U.S. bond market is a few years ahead of the European market. This makes sense when we consider the respective stages in the two regions’ economic cycles. The U.S. Federal Reserve resumed hiking interest rates in December and is expected to continue hiking—albeit gradually—over the next few years. By contrast, the European Central Bank (ECB) announced an extension of its QE program in December and appears unlikely to consider tapering until mid- 2017. The higher correlations currently seen in the U.S. could occur in Europe within the next few years, which will have major implications for bond investors whose strategies involve diversifying across government bonds and credit.
One approach under threat is the barbell strategy, which can take different forms but typically divides the portfolio into two heavily concentrated buckets of lower- and higher-risk assets in order to generate better risk-adjusted returns. Barbell strategies are a hugely popular investment approach, and with good reason: Since the 2008 financial crisis, various forms of barbell strategies have helped large numbers of investors to successfully negotiate a volatile and difficult period in markets.
THE END OF THE FIXED INCOME BARBELL STRATEGY?
For a barbell strategy to succeed over the long term, however, the two sides of the barbell need to maintain low correlation to each other. When two sides of a barbell are highly correlated— as is the case at present—it ceases to be an effective way of managing risk and becomes instead a highly risky strategy. In this case, if both Treasuries and credit decline simultaneously, major losses will follow. A more flexible approach is likely to deliver better results over the long term—one that considers the full spectrum of the fixed income universe, in particular regions and countries that are less correlated to major markets.
Greater choice does not necessarily make the job of fixed income investors any easier—with more options comes the need for more research, due diligence, and risk management. However, investors who actively embrace this wider opportunity set are ultimately likely to find their efforts rewarded, while those who do not seek access to different bond markets could miss potential performance enhancement and diversification.
GETTING TO THE CORE
FIGURE 5: The “Egg” Approach
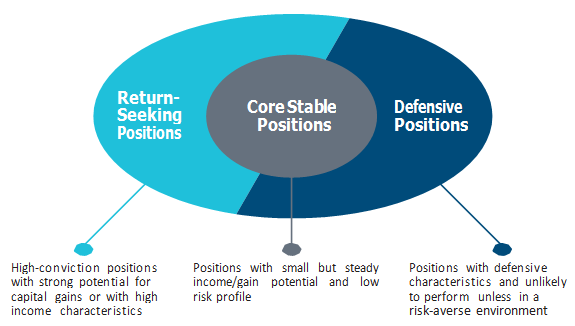
A bond allocation managed in this way can provide a number of benefits to investors, including stable predictable income, downside protection, capital preservation, and diversification to equity markets. An unconstrained approach to fixed income is the best way to achieve this—investors should be prepared for the unexpected and able to react quickly to changing circumstances, which means investing across markets and different types of bonds, on both the long and short side. Traditional approaches to fixed income market investing are often constrained by benchmarks that are dominated by the largest issuers of debt. Such approaches could potentially fail to deliver optimal results, especially when interest rates are on the move. In a world of multispeed economic growth and differing interest rate cycles, the ability to shift strategy focus quickly can make a huge difference to performance.
2016-GL-3452
重要資訊
本文件(包括其中所載的任何陳述、資訊、數據和內容)以及與本文件一併提供的任何資料、資訊、圖像、連結、聲音、圖像或視頻(統稱為「資料」)乃由普信提供,並僅作一般資訊用途。本資料並不擬供在禁止或限制分發本資料的司法管轄區和在本資料須按特定要求提供的若干國家之人士使用。本資料不擬派發予任何司法管轄區的散戶投資者。在任何情況下,本資料的全部或部分內容均不得在未經普信同意下複製或再分發或出示予任何人士。本資料並不構成於任何司法管轄區分銷、要約、邀請、建議或徵求發售或購買任何證券。本資料並未經由任何司法管轄區的任何監管機關審閱。本資料並不構成任何投資意見,不得加以依賴。投資者務請在作出任何投資決策前先尋求獨立法律和財務意見(包括有關稅務後果的意見)。
