
January 2021 / MARKET OUTLOOK
Euro High Yield: The Opportunity Today
An attractive option for income seekers
Key points
- On both an absolute and relative basis, euro high yield (EHY) bonds have a useful role to play in income seekers’ portfolio allocation. EHY spreads ended 2020 at a 5-year high relative to investment grade corporates1 .
- Over the past 20 years, EHY has generated double the annual return of European equities, at two thirds of the volatility.
- Euro high yield does not limit investors to European companies. Over the years, the issuer profile has become more global.
- In the past year the EHY market has grown, and ‘fallen angels’ have changed the structure of the market.
- Wide dispersion means the single-B category remains the best hunting ground for active security selectors.
- For much of 2020 after the March COVID-19 selloff, we focused on the ‘stay-at-home’ businesses, such as cable and wireless operators, which were most resilient to the pandemic. We found some attractive opportunities among the fallen angels.
- Today many of the winners from COVID have rallied close to their par value and are looking less attractive. We have started seeing opportunities in companies that were hit harder by the pandemic, including names in the Services, Entertainment & Leisure and Gaming sectors.
The upheavals of 2020 have brought structural changes in the euro high yield (EHY) bond market. So, what has changed, what still applies, and what role can this sector play in European investors’ portfolios in the year ahead?
Still an attractive income asset
On both an absolute and relative basis, EHY has a useful role to play in income seekers’ portfolio allocation.
The EHY market (excluding-financials) ended the year with an average yield of 3.1 %: well below its March spike, but still attractive relative to Bunds in negative territory and euro investment-grade corporates at less than 1%.
Relative to investment grade, EHY spreads are their most attractive in five years. At the beginning of 2020, the average euro high-yield spread was 3.6 times the average investment grade (IG) spread. By the end of the year that HY/IG spread ratio had risen to 4.1 times.
From a risk-return perspective, EHY compared well with European equities. EHY returned 2.8% with volatility of 15.6%, compared with the MSCI Europe’s losses of -3.3% and volatility of 23.9%. On a 20-year basis, annualised, EHY returns were double those of equities (6.1% a year vs. 2.9%) at about two thirds of the volatility (10.4% vs. 15.4%.)
A growing and maturing market
The EHY market has become larger, deeper and more liquid since the Global Financial Crisis, growing from roughly US$110 billion in 2008 to more than US$750 (EUR 615) billion today – a compound annual growth rate of about 16% (compared with less than 5% for US high yield)2. The Covid-19 related surge in financing activity boosted EHY debt outstanding by a further 21% last year.
A key structural change has been the migration of ‘fallen angels’ from investment grade to high yield last year, which changed the credit profile of the market as the proportion of BB rated issues rose from 67% to 71%.
It’s worth noting a longer-term structural trend: The EHY issuer profile has also become more diverse. For example, today roughly 14% of EHY debt outstanding is from US names such as Avis, Netflix and Levi Strauss, compared with 0% in 2008. (For global companies increasing their footprint in Europe, it makes sense to finance that expansion in euro.)
The structural appeal of single-B names continues
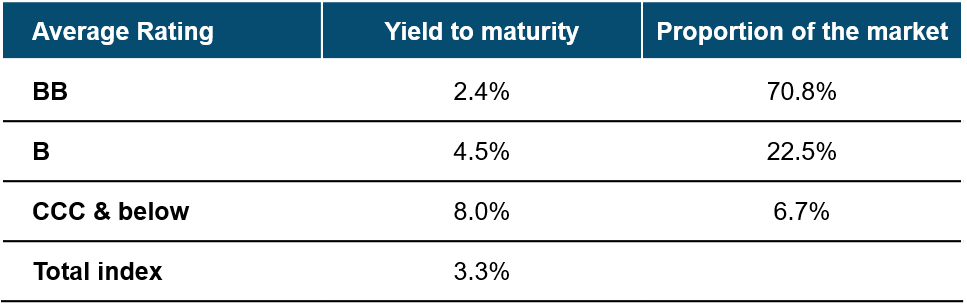
Our long-term preference for the single-B segment remains. For several years, we have seen ‘tourism’ from investment-grade players seeking additional yield, which in recent years been reinforced by the European Central Bank’s corporate bond buying. This has kept demand for double-B bonds high and spreads relatively compressed, so that in many cases they offer very little cushion against the risk of capital losses at times of market stress. By the end of the year double Bs yielded 2.4%, compared 4.5% in the single-B segment (see table).
As we know, in high yield the key to managing credit risk, avoiding the losers and adding value is security selection. And a key attraction of the single-B category is its wide dispersion in pricing. For example, in 2020, the average yield-to-worst of the BofA Euro High Yield Index was about 4.4%. But yields on new bond issues ranged from less than 2% to more than 9%. Wider dispersion implies greater returns to active management, or, to put it differently, successfully separating the winners from the losers can lead to greater outperformance.
THE EUROPEAN HIGH YIELD MARKET
As of 31 December 2020
ICE BofA European Currency High Yield Constrained Excluding Subordinated Financials Index hedged to EUR.
Source: ICE BofA, Moody’s. Please see Additional Disclosures
The opportunity today
For much of 2020 after the March COVID-19 selloff, we focused on the ‘stay-at-home’ businesses, such as cable and wireless operators, which were most resilient to the pandemic. We also found some attractive opportunities among the fallen angels.
Today many of the winners from COVID have rallied close to their par value and are looking less attractive. We have started seeing opportunities in companies that were hit harder by the pandemic, including names in the Services, Entertainment & Leisure and Gaming sectors. Some of these are trading at 70% to 80% of par value but have ample liquidity to meet their coupons and capital repayments for the next two years. We are focusing on management teams who we believe can adapt to a rapidly changing world and exploit opportunities.
What are the risks?
In contrast to high-grade corporate bonds, EHY has lower interest rate exposure and higher credit risk.
At the end of 2020 the EHY market had an average duration of about 3.5 years compared with more than 5 years for euro investment grade, more than 8 years for Bunds and more than 13 years for UK Gilts.
Company-specific (idiosyncratic) risk is the crucial driver of both and risk and return in this asset class. According to Moody’s data, the European speculative grade (high yield) default rate stood at 4.3% in October 2020, compared with 9.1% in the US. Structural factors play a part here. For example, the US has a higher proportion of B-rated debt; it has a higher weighting to oil and gas (which was hit hard last year), and it tends to be easier to declare bankruptcy in the US than it is in Europe.
The significant fiscal and monetary intervention we are seeing is likely to help mitigate the impact of the Covid-19 pandemic. We are likely to see further defaults in 2021, but we think default rates, having peaked last year, will continue to come down.
The key is in-depth research to identify management teams that are looking to deleverage their balance sheets and improve their credit metrics.
Risks - The following risks are materially relevant to the portfolio:
Credit risk—a bond or money market security could lose value if the issuer's financial health deteriorates.
Default risk—the issuers of certain bonds could become unable to make payments on their bonds.
Derivatives risk—derivatives may result in losses that are significantly greater than the cost of the derivative.
Emerging markets risk—emerging markets are less established than developed markets and therefore involve higher risks.
High yield bond risk—A bond or debt security rated below BBB- by Standard & Poor’s or an equivalent rating, also termed ‘below investment grade’, is generally subject to higher yields but to greater risks too.
Interest rate risk—when interest rates rise, bond values generally fall. This risk is generally greater the longer the maturity of a bond investment and the higher its credit quality.
Liquidity risk—any security could become hard to value or to sell at a desired time and price.
Sector concentration risk—the performance of a portfolio that invests a large portion of its assets in a particular economic sector (or, for bond portolios, a particular market segment), will be more strongly affected by events affecting that sector or segment of the fixed income market.
General Portfolio Risks
Capital risk- The value of your investment will vary and is not guaranteed. It will be affected by changes in the exchange rate between the base currency of the portfolio and the currency in which you subscribed, if different.
Equity risk- In general, equities involve higher risks than bonds or money market instruments.
Geographic concentration risk- To the extent that a portfolio invests a large portion of its assets in a particular geographic area, its performance will be more strongly affected by events within that area.
Hedging risk- A portfolio's attempts to reduce or eliminate certain risks through hedging may not work as intended.
Investment portfolio risk- Investing in portfolios involves certain risks an investor would not face if investing in markets directly.
Management risk- The investment manager or its designees may at times find their obligations to a portfolio to be in conflict with their obligations to other investment portfolios they manage (although in such cases, all portfolios will be dealt with equitably).
Operational risk- Operational failures could lead to disruptions of portfolio operations or financial losses.
IMPORTANT INFORMATION
This material is being furnished for general informational and/or marketing purposes only. The material does not constitute or undertake to give advice of any nature, including fiduciary investment advice, nor is it intended to serve as the primary basis for an investment decision. Prospective investors are recommended to seek independent legal, financial and tax advice before making any investment decision. T. Rowe Price group of companies including T. Rowe Price Associates, Inc. and/or its affiliates receive revenue from T. Rowe Price investment products and services. Past performance is not a reliable indicator of future performance. The value of an investment and any income from it can go down as well as up. Investors may get back less than the amount invested.
The material does not constitute a distribution, an offer, an invitation, a personal or general recommendation or solicitation to sell or buy any securities in any jurisdiction or to conduct any particular investment activity. The material has not been reviewed by any regulatory authority in any jurisdiction.
Information and opinions presented have been obtained or derived from sources believed to be reliable and current; however, we cannot guarantee the sources' accuracy or completeness. There is no guarantee that any forecasts made will come to pass. The views contained herein are as of the date noted on the material and are subject to change without notice; these views may differ from those of other T. Rowe Price group companies and/or associates. Under no circumstances should the material, in whole or in part, be copied or redistributed without consent from T. Rowe Price.
The material is not intended for use by persons in jurisdictions which prohibit or restrict the distribution of the material and in certain countries the material is provided upon specific request.
It is not intended for distribution retail investors in any jurisdiction.