
November 2021 / OUTLOOK
The Three Dynamics Shaping a Promising Outlook for Europe
Innovation, sustainability, and the market cycle create distinct opportunities
Key Insights
- The T. Rowe Price European Select Equity Strategy recently celebrated its two‑year anniversary, with the SICAV launching on September 10, 2019, under the management of Toby Mueller, who has been with the firm for 10 years.
- This was the third product to be added to the all‑cap European equity suite, joining the more diversified European Equity and Europe ex‑UK strategies.
- A region rich in innovation and disruption and with an edge in tackling sustainability issues, combined with a shift in the market cycle, sets the stage for a promising future.
The T. Rowe Price European Select Equity Strategy has performed strongly in a volatile market since its debut two years ago. We believe a large part of the explanation for this success comes down to three key elements: our investment philosophy and process, which focuses on innovation and exploiting the investment edge provided by our high‑quality in‑house research; the lessons we have learned from executing and testing our approach; and the opportunities offered by a large, complex market.
As the strategy enters its third year, we view three dynamics as shaping the prospects for the European equity space and the opportunities within the universe:
- A region rich in innovation and disruption
- A leading edge in sustainability
- A shift in the market cycle
Europe Is Rich in Innovation and Disruption
Our aim is to identify, thoroughly understand, and back high‑quality growth companies that are innovators, disruptors, and, as we see it, on the right side of change—qualities that know no national or regional boundaries.
Innovation is not the preserve of the U.S. or Asia, a view that has perhaps been supported by the rise of the FAANGs (Facebook, Apple, Amazon, Netflix, and Alphabet) and their dominant performance over the past decade. Europe, perceived as being encumbered with mostly traditional businesses and dysfunctional banks, is in fact home to a multitude of cutting‑edge manufacturers and a growing number of disruptive health care and information technology companies.
The innovation theme has been central to the construction of the concentrated portfolio within Europe Select. Examples among our top investments include:
- ASML Holding has a monopoly on next‑generation high‑end lithography tools (EUV machines) for semiconductor manufacturers. They will adopt this new machine to increase the number of transistors onto a chip to power cutting‑edge applications.
- Siemens, a global industrial company operating in the power and gas, digital factory, and process industries and in renewables markets benefiting from the so‑called fourth industrial revolution.
- Lonza Group, a Swiss company that is a leading contract manufacturer for drug companies and has a competitive advantage in the rapidly expanding sphere of biologics manufacturing.
- Teleperformance, a global customer experience provider that has become an indispensable part of the fast‑growing digital economy.
Sustainability Leadership Makes ESG Integration Crucial for European Equities
Europe is in the vanguard of innovation driven by a long‑standing focus on environmental, social, and governance (ESG) factors.
From a regulatory perspective, more countries in Europe have net‑zero emission pledges written into their laws than in North America, Asia, and Latin America.
The European Union’s (EU) net‑zero target date is 2050, supported by a framework of climate legislation. Some member countries have adopted even more aggressive targets, including Finland (2035), Iceland (2040), and Germany (2045). The UK is legally bound to a 2050 target date. The U.S. has only just rejoined the Paris Agreement and aims to achieve its target by no later than 2050.
Meanwhile, unlike other regions, the EU has also adopted distinct regulations that are helping to channel capital flows toward ESG initiatives.
Furthermore, the MSCI Europe Index contains the largest proportion of companies that are better ranked on ESG metrics, with 58% rated AA and AAA. That compares with 20% in the MSCI USA Index; 34% in the MSCI World Index, which represents 23 developed country benchmarks; and 21% in the MSCI ACWI Index, which captures 25 developed and 27 emerging market countries.
Many European companies have already built sustainable supply chains and this effort cannot be replicated overnight by competitors. In a world where sustainability is a heightened concern of regulators, consumers, and investors, many are well positioned as leaders in their fields.
In keeping with our aim of picking companies that we think are on the right side of change, ESG considerations are integrated across the four pillars of our investment process (quality, change, insight, and valuation). Our investment‑driven engagement program frequently identifies targets through our proprietary Responsible Investing Indicator Model (RIIM) analysis, governance screening, and analysts’ fundamental research.
The strategy is rated by third‑party providers as having best‑in‑class ESG integration. Morningstar has awarded it a sustainability rating of 4 out of 5 globes, and MSCI has bestowed an AA rating. In addition, every stock in the portfolio is “green” rated—the top compliance score—by our RIIM model, which is designed as a tool for ESG integration.
An example among our holdings of best‑in‑class ESG practice is Symrise, a supplier of flavorings and fragrances to food, beverage, cosmetic, and personal care producers. The company won the German Sustainability Award in 2019—one of many such awards—in recognition of its responsible approach to business. Management has placed great emphasis on investment in strategic, sustainable sourcing of natural inputs, building up an extensive chain of sustainable farmer and agricultural producers since the mid‑2000s. This backward supply chain integration is hard to replicate and gives Symrise an advantage over competitors.
Symrise is among those companies that make us now think ESG considerations can be even more crucial to commercial and investment success, as actions by consumers, companies, regulators, and others escalate their importance.
Why the Market Cycle May Favor Europe
A period of European equity underperformance relative to the U.S. is, we believe, exceptional on a historical, long‑term view. Indeed, a number of factors are combining to turn the tide. As can be seen in Figure 1, the underperformance of Europe (MSCI Europe Index) relative to the U.S. (S&P 500 Index) has been concentrated in the past decade. Meanwhile, the latter’s recent outperformance has been mainly driven by the stellar performance of the previously mentioned five big technology stocks.
A Longer View of Europe’s Performance Relative to the U.S.
(Fig. 1) On a multi‑decade view, relative underperformance of the MSCI Europe Index versus the S&P 500 Index is concentrated in the last decade
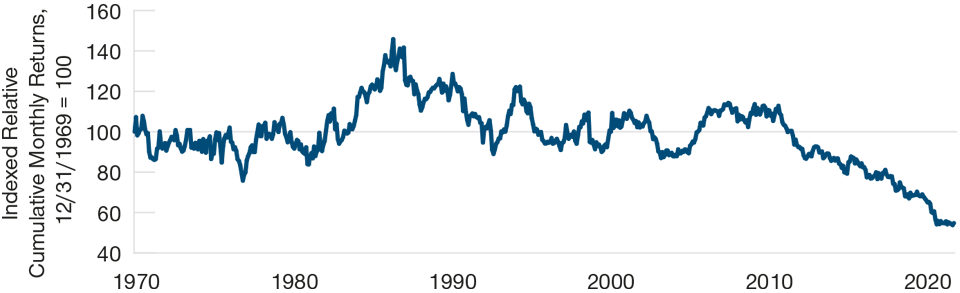
Past performance is not a reliable indicator of future performance.
As of September 30, 2021.
Series represents relative cumulative monthly returns, indexed to 100 at 12/31/1969. All data are total returns expressed in local currency.
Sources: MSCI (see Additional Disclosures), FactSet. Financial data and analytics provider FactSet. Copyright 2021 FactSet. All Rights Reserved. Leuthold Group.
Relative Performance in Perspective—Five U.S. Stocks Prominent
(Fig. 2) Biggest adverse impacts on relative performance between Europe (MSCI Europe Index) and the U.S. (S&P 500 Index)
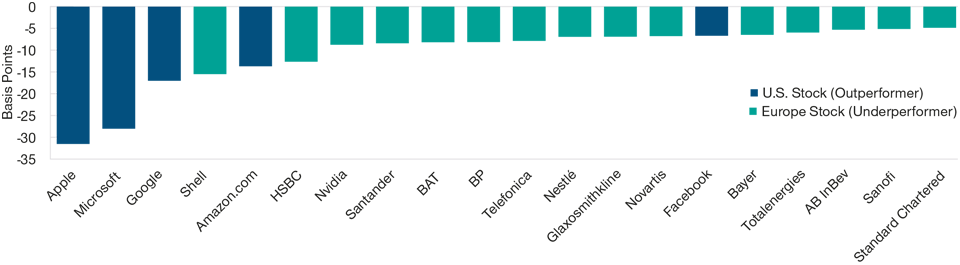
Past performance is not a reliable indicator of future performance.
The specific securities identified and described are for informational purposes only and do not represent recommendations.
As of September 30, 2021.
Source: FactSet. Financial data and analytics provider FactSet. Copyright 2021 FactSet. All Rights Reserved. Analysis by T. Rowe Price.
There are signs that a reappraisal may now be underway. Negative perceptions have begun to shift as the Continent’s strong recovery in the wake of the coronavirus pandemic has rekindled investor interest. The European Union’s crisis management has also proved more effective, with the 27 member states uniting behind a massive recovery fund that will offer grants, not loans, based on need, not size. To finance this effort, they will issue joint debt, which should add impetus to financial integration. In previous crises, the EU has relied on Germany’s financial firepower to help ailing members.
The pandemic has served as a catalyst for profound economic change, accelerating trends that were emerging before the crisis, particularly the shift from the offline to the online world and the further heightening of awareness around sustainability. As a pioneer in ESG and sustainability efforts, which are only now becoming more salient in the U.S., Europe is well placed to grow the next generation of large companies in the years ahead.
Active Is Vital in This Arena
The European market is complex, with 15 countries in the main equity benchmark but approaching 50 on a broader definition of the region, using multiple languages, currencies, and regulatory regimes. Many opportunities may be obscure smaller and family‑run businesses as well as listed large‑ and mid‑cap companies. In our view, this “messy complexity” reinforces the need for an active investment management approach backed by robust research resources that can explore and analyze these markets.
Our strategy is all‑cap, concentrated, and unconstrained. It does not resemble the benchmark index and avoids poorly positioned businesses, low‑quality, and junk stocks. Instead, we seek between 25 and 45 high‑quality companies that we believe will benefit from change but only include them if we have an insight on the key drivers of the stock and the valuation presents us with a very appealing risk/reward setup. Active share of the portfolio is almost 90%.
The rigor of our investment process generates the confidence to invest with conviction in our best ideas. Our dedicated European research team of 23 analysts and 11 associate analysts plays a pivotal role in the hunt for insights, which is at the core of our stock selection process. Mr. Mueller can also rely on an Advisory Committee of three other portfolio managers and four analysts as a forum for discussing ideas about both actual and potential holdings in detail.
A Promising Foundation for Stock Selection
After two years under Mr. Mueller’s management, the strategy has proven to be a welcome addition to the pooled fund options available for the European suite. Mr. Mueller has navigated a complex and volatile market adroitly, building up an excellent track record. In terms of his personal development as an investor, he feels he can now more quickly identify and deal with an investment thesis that starts to unravel—which is especially relevant when managing a concentrated strategy. In addition, being on “the right side of change,” the importance of ESG to investment success, and building strong relationships with analysts are among the main lessons learned over this period.
GIPS® Disclosure
European Select Equity Composite
Period Ended December 31, 2020
Figures Are Shown in euro
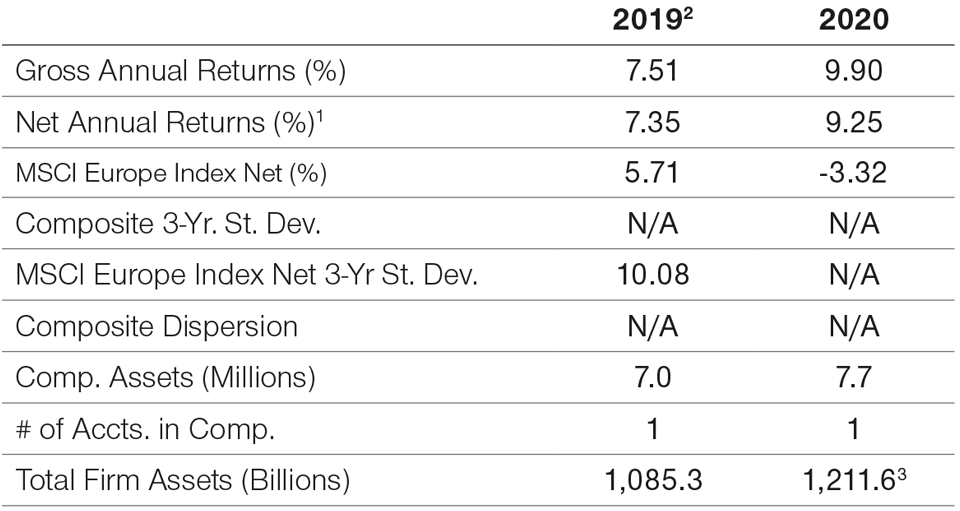
1Reflects deduction of highest applicable fee schedule without benefit of breakpoints. Investment return and principal value will vary. Past performance is not a reliable indicator of future performance. Monthly composite performance is available upon request. See below for further information related to net of fee calculations.
2 September 30, 2019 through December 31, 2019.
3 Preliminary—subject to adjustment.
T. Rowe Price (TRP) claims compliance with the Global Investment Performance Standards (GIPS®) and has prepared and presented this report in compliance with the GIPS standards. TRP has been independently verified for the 24-year period ended June 30, 2020 by KPMG LLP. The verification report is available upon request. A firm that claims compliance with the GIPS standards must establish policies and procedures for complying with all the applicable requirements of the GIPS standards. Verification provides assurance on whether the firm’s policies and procedures related to composite and pooled fund maintenance, as well as the calculation, presentation, and distribution of performance, have been designed in compliance with the GIPS standards and have been implemented on a firm wide basis. Verification does not ensure the accuracy of any specific composite presentation.
TRP is a U.S. investment management firm with various investment advisers registered with the U.S. Securities and Exchange Commission, the U.K. Financial Conduct Authority, and other regulatory bodies in various countries and holds itself out as such to potential clients for GIPS purposes. TRP further defines itself under GIPS as a discretionary investment manager providing services primarily to institutional clients with regard to various mandates, which include U.S., international, and global strategies but excluding the services of the Private Asset Management group. The minimum asset level for equity portfolios to be included in composites is $5 million and prior to January 2002 the minimum was $1 million. The minimum asset level for fixed income and asset allocation portfolios to be included in composites is $10 million; prior to October 2004 the minimum was $5 million; and prior to January 2002 the minimum was $1 million. Valuations and performance are computed in U.S. dollars and converted to Euro. When converting U.S. dollar composite returns, benchmarks, dispersion and asset data, the same exchange rate source is used consistently. Total returns in non-U.S. dollar currencies are calculated by adjusting U.S. dollar performance by the percent change in the U.S. dollar/foreign currency exchange rate (as determined by an independent third party) for the time periods selected.
Gross performance returns are presented before management and all other fees, where applicable, but after trading expenses. Net of fees performance reflects the deduction of the highest applicable management fee that would be charged based on the fee schedule contained within this material, without the benefit of breakpoints. Gross and net performance returns reflect the reinvestment of dividends and are net of nonreclaimable withholding taxes on dividends, interest income, and capital gains. Gross performance returns are used to calculate presented risk measures. Effective June 30, 2013, portfolio valuation and assets under management are calculated based on the closing price of the security in its respective market. Previously portfolios holding international securities may have been adjusted for after-market events. Policies for valuing portfolios, calculating performance, and preparing compliant presentations are available upon request. Dispersion is measured by the standard deviation across asset-weighted portfolio returns represented within a composite for the full year. Dispersion is not calculated for the composites in which there are five or fewer portfolios.
Some portfolios may trade futures, options, and other potentially high-risk derivatives which generally represent less than 10% of a portfolio.
Benchmarks are taken from published sources and may have different calculation methodologies, pricing times, and foreign exchange sources from the composite.
Composite policy requires the temporary removal of any portfolio incurring a client initiated significant cash inflow or outflow greater than or equal to 15% of portfolio assets. The temporary removal of such an account occurs at the beginning of the measurement period in which the significant cash flow occurs and the account re-enters the composite on the last day of the current month after the cash flow. Additional information regarding the treatment of significant cash flows is available upon request.
The firm’s list of composite descriptions, a list of limited distribution pooled fund descriptions, and a list of broad distribution pooled funds are available upon request. GIPS® is a registered trademark of CFA Institute. CFA Institute does not endorse or promote this organization, nor does it warrant the accuracy or quality of the content contained herein.
Fee Schedule
European Select Equity Composite. The European Select Equity Composite seeks long-term capital appreciation by investing in a focused number of European companies in developed and emerging markets. The strategy targets attractive opportunities across the investable universe with a slight tilt towards growth and companies with large/medium market capitalizations. (Created September 2019; incepted September 30, 2019.)
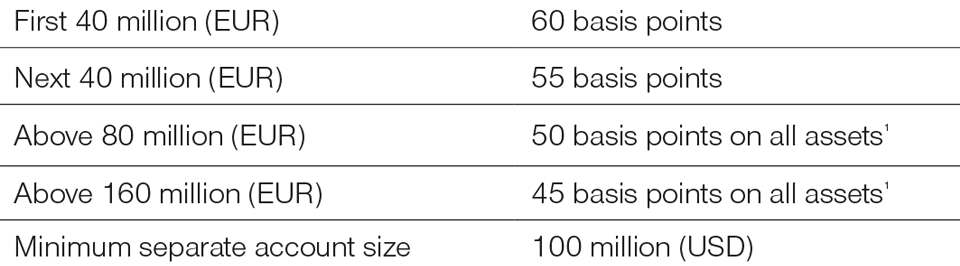
1A transitional credit is applied to the fee schedule as assets approach or fall below the breakpoint.
The specific securities identified and described are for informational purposes only and do not represent recommendations.
General Portfolio Risks:
Capital risk—the value of your investment will vary and is not guaranteed. It will be affected by changes in the exchange rate between the base currency of the portfolio and the currency in which you subscribed, if different.
ESG and Sustainability risk—May result in a material negative impact on the value of an investment and performance of the portfolio.
Equity risk—in general, equities involve higher risks than bonds or money market instruments.
Geographic concentration risk—to the extent that a portfolio invests a large portion of its assets in a particular geographic area, its performance will be more strongly affected by events within that area.
Hedging risk—a portfolio’s attempts to reduce or eliminate certain risks through hedging may not work as intended.
Investment portfolio risk—investing in portfolios involves certain risks an investor would not face if investing in markets directly.
Management risk—the investment manager or its designees may at times find their obligations to a portfolio to be in conflict with their obligations to other investment portfolios they manage (although in such cases, all portfolios will be dealt with equitably).
Operational risk—operational failures could lead to disruptions of portfolio operations or financial losses.
IMPORTANT INFORMATION
This material is being furnished for general informational and/or marketing purposes only. The material does not constitute or undertake to give advice of any nature, including fiduciary investment advice, nor is it intended to serve as the primary basis for an investment decision. Prospective investors are recommended to seek independent legal, financial and tax advice before making any investment decision. T. Rowe Price group of companies including T. Rowe Price Associates, Inc. and/or its affiliates receive revenue from T. Rowe Price investment products and services. Past performance is not a reliable indicator of future performance. The value of an investment and any income from it can go down as well as up. Investors may get back less than the amount invested.
The material does not constitute a distribution, an offer, an invitation, a personal or general recommendation or solicitation to sell or buy any securities in any jurisdiction or to conduct any particular investment activity. The material has not been reviewed by any regulatory authority in any jurisdiction.
Information and opinions presented have been obtained or derived from sources believed to be reliable and current; however, we cannot guarantee the sources' accuracy or completeness. There is no guarantee that any forecasts made will come to pass. The views contained herein are as of the date noted on the material and are subject to change without notice; these views may differ from those of other T. Rowe Price group companies and/or associates. Under no circumstances should the material, in whole or in part, be copied or redistributed without consent from T. Rowe Price.
The material is not intended for use by persons in jurisdictions which prohibit or restrict the distribution of the material and in certain countries the material is provided upon specific request.
It is not intended for distribution retail investors in any jurisdiction.
