
INVESTMENT INSIGHTS
Prospects for a Shift Back to Value
December 2019
Sebastien Mallet
, Portfolio Manager, Global Value Equity Fund
Key insights
- After a prolonged growth cycle, we feel the environment is becoming increasingly more favorable to value investing.
- Reversals of style regimes can be unpredictable but typically happen abruptly and can be sustained for a long time. We question how well positioned many investors are for such a change.
- The narrow leadership and bifurcated nature of markets have left many opportunities for investors with a value perspective.
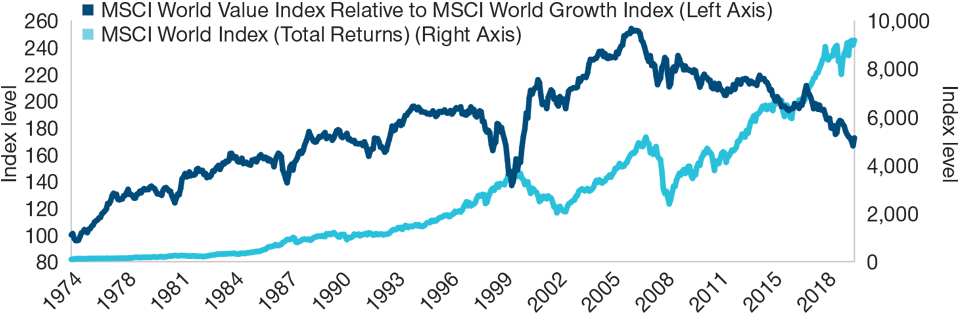
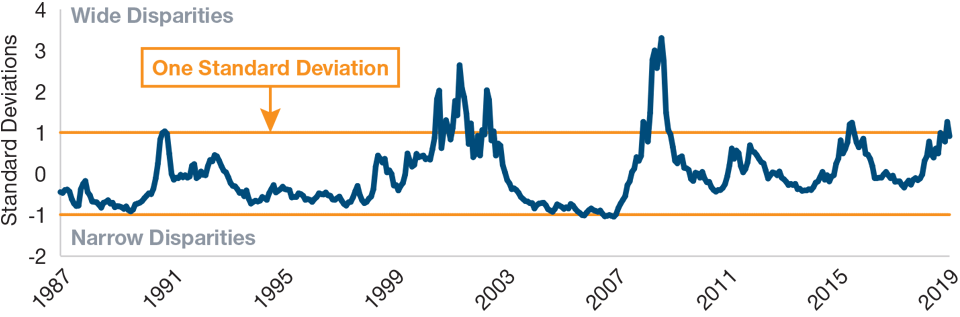
(Fig. 1) Value’s Underperformance vs. Growth Seems Overdone
Factors are building that could see a reversal
As of September 30, 2019
Past performance is not a reliable indicator of future performance.
Sources: FactSet and MSCI (see Additional Disclosures).
Value investing has been out of favor for some time, weighed down by a backdrop of low economic growth, low inflation, and record low interest rates. More recently, however, we have seen a sporadic rotation out of momentum‑driven growth stocks into more cyclically oriented value names. Is this just a short‑term movement, or are we about to witness a more sustainable shift back in favor of value over growth stocks? This is important as history tells us that when regime changes happen, they can be swift and dramatic, with large stock price movements.
... we feel the environment is becoming increasingly favorable to value investing
The Case for Reevaluating Value
For much of the past decade, growth style investing has dominated. (Figure 1 demonstrates the extended period of outperformance for growth stocks.) To an extent, this has been justified by fundamentals—technological advances, structural changes in slower growing economies, and lower inflation that has helped power markedly better cash flow and earnings for growth sectors of the market. Investors’ preferences have been further reinforced by policy actions—not least the unprecedented suppression of interest rates and the deleveraging that has occurred.
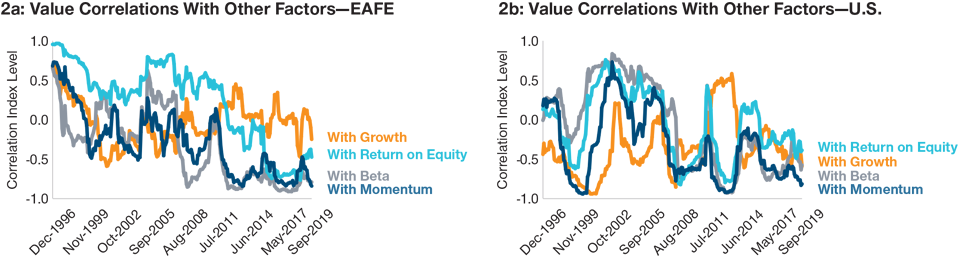
Valuation spreads between high and low momentum stocks in general have also widened appreciably, with the recent rotation in the market only reducing that slightly. Along with the strong performance in momentum stocks in recent years, we have also seen other quality‑related factors, such as return on equity and growth, perform well. A consequence of this has been an even sharper divergence with the performance of value. Figures 2a and 2b show not only the negative correlations, but also the fact that they have been approaching historic extremes. This reinforces our impression that markets could be due to correct.
So, is the recent movement just a short‑term reaction to factor relationships that had become too extreme, or are we on a cusp of a more sustainable regime shift back in favor of value over growth stocks?
Using our analysis, we see that regime shifts have occurred in a range of different economic environments. We do not necessarily need a new economic upswing for value to reassert itself. Although many parts of the value universe are economically sensitive, such as banks and “high cyclical” industrials, there is also a healthy representation of more defensive areas, such as utilities and other traditional industries.
Historically, the backdrop for a value recovery is often one where relative valuations have become extreme, and broader performance patterns are upended. As seen in Figure 1, market turning points are often quite contemporaneous with regime changes, while Figure 3 shows the current relative valuation levels in relation to history.
(Fig. 2) Diversification Benefits of Value
Negative correlations approaching historic extremes
As of September 30, 2019
Sources: T. Rowe Price, Kenneth French Data.
EAFE data: Data from Morgan Stanley Capital International for 1996 to 2006 and from Bloomberg for 2007 to present.
U.S. data: Includes all NYSE, AMEX, and NASDAQ firms with the necessary data.
Analysis is for research purposes only and does not represent actual portfolios or investments. Factors were defined by Kenneth French using portfolios formed on size, portfolios formed on book-to-market value, portfolios formed on operating profitability and portfolios formed on investment. See Additional Disclosures.
(Fig. 3) Value Maintains Its Valuation Discount
Relative valuations have become even more attractive
As of September 30, 2019
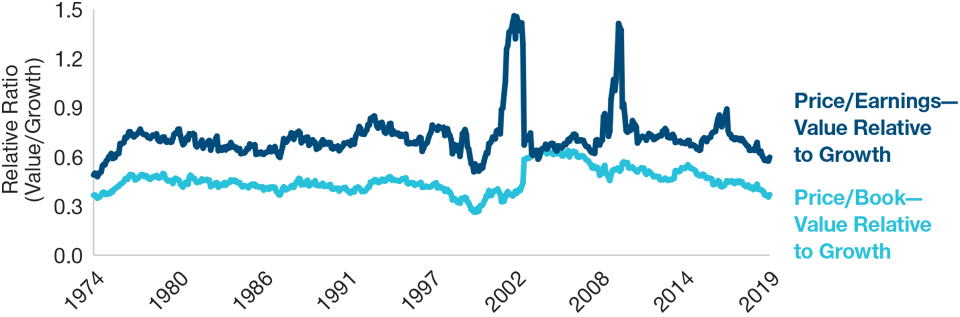
Relative valuation measures: We have divided the ratios for the MSCI World Value Index by the ratio for MSCI World Growth Index to demonstrate the differential.
Sources: FactSet and MSCI (see Additional Disclosures). Analysis by T. Rowe Price.
While it is difficult to accurately time a reversal in style regimes, extreme valuation gaps have typically been one of the key catalysts. We would also argue that the current low relative valuation starting point for many stocks within the value universe represents a margin of safety in today’s environment.
However, any eventual shift in style regime does not necessarily signify a uniform downturn for growth stocks. Many with the best growth profiles continue to generate some of the highest free cash flow margins. But, if the global economy continues to slow or move into recession, we expect that these companies will be in unchartered waters. There are no previous cycles where such dominant companies have had to adapt to a sluggish economy that could work to undermine their growth. This contrasts with the value sector, which features companies that have been operating for more than 100 years through a range of economic cycles. We therefore have a greater, perhaps more predictable, understanding as to how these firms are likely to perform when economies change course.
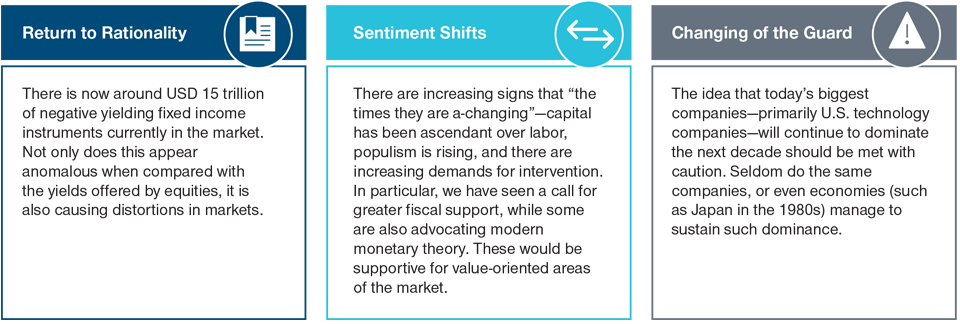
Factors That Could Propel a Regime Shift Back to Value
Relative valuation levels present exciting opportunities for bottom-up stock pickers, particularly for those with a marked value perspective.
Disruption Is Real, But It Is Not a One‑Way Street
Disruption is real, and the dynamics of this has created divergent outcomes across a range of industries to the expense of many incumbent competitors. At the same time, we believe that in many corners of the market the hopes for today’s winners—as reflected in their valuations and the consensus belief in them—could well disappoint. The risks to them—including their own disruption, further technological shifts, increasing costs of capital and regulation—are real. While the consistent propensity for investors to overestimate both the magnitude and persistence of earnings growth for these companies is also a potential barrier.
However, we are ever diligent about the risks that value‑oriented companies face and how disruption is impacting companies more generally. There is an elevated level of uncertainty in many investors’ minds due to the structural changes that have occurred. That is why it is important to remain disciplined in order to avoid value traps. But we would also point out that long‑established brands are fighting back and adapting to the “new world.” They are developing their own capabilities, acquiring or partnering with innovators. Also, many traditional business models remain highly relevant and continue to provide durable earnings growth.
Higher Valuations and Greater Dispersion Favor Active Approach
With the market reflecting some extreme levels (in terms of growth outperformance and value underperformance), it is presenting exciting opportunities for bottom‑up stock pickers, particularly for those with a marked value perspective. Over the past 18 months, the market has seen increasing dispersion in performance and widening valuation spreads (Figure 4).
Near Term and Beyond
It remains to be seen whether the recent occasional bouts of factor rotation are a sign that we are on the cusp of a major shift in style regimes. However, there can be no denying that the current growth cycle has been both extended and dramatic. There is also an increasing recognition that the investment landscape may be changing, not least a challenge to the prevailing deflationary mindset. Signs of improving macro conditions, ongoing monetary stimulus, extreme valuation differentials, and stretched positioning are combining as a compelling backdrop for a recovery in value.
(Fig. 4) Valuation Spreads Near Historical Peaks
Increased dispersion offer opportunities for stock pickers
As of September 30, 2019
Developed markets spreads are represented by the MSCI World Index. Top quintile compared with the market average. We form value and growth portfolios in each country using four ratios: book-to-market (B/M); earnings-price (E/P); cash earnings to price (CE/P); and dividend yield (D/P). Firms in the country portfolios are value-weighted. To construct the developed market spreads, we weight each country in proportion to its global weight. Analysis is for research purposes only and does not represent actual portfolios or investments.
Source: Empirical Research Partners Analysis.
...when regime changes happen, they can be swift and dramatic, with large stock price movements
With markets currently elevated, and after a prolonged growth cycle, we feel relative prices favor value‑orientated areas of the market. Specifically, stock‑specific valuation multiples have widened—creating a much better backdrop for value stock pickers.
Historical evidence argues for style change, but we may still be too early to persuade the skeptics. The market’s enthusiasm for some of the attributes of growth stocks may be hard to move, but they will likely start to weaken. As noted, when regime changes happen, they can be swift and dramatic. Equity investors will not want to find themselves isolated on the wrong side of any shift.
What we're watching next
The following are potential short-term triggers that could cause investors to dramatically reassess their positioning: (1) Resolution of trade and tariff concerns—clearly the U.S.-China relationship is in the headlines, but there are also concerns about escalation involving Europe. (2) Effective policy stimulus—with the space for further monetary easing being squeezed, the onus is shifting more toward a fiscal response. (3) A pickup in nominal activity—economic data have worsened materially, providing scope for a pickup, whereas any signs of incipient inflation could be profound.
Additional Discosures
Financial data and analytics provider FactSet. Copyright 2018 FactSet. All Rights Reserved.
MSCI and its affiliates and third party sources and providers (collectively, “MSCI”) makes no express or implied warranties or representations and shall have no liability whatsoever with respect to any MSCI data contained herein. The MSCI data may not be further redistributed or used as a basis for other indices or any securities or financial products. This report is not approved, reviewed, or produced by MSCI. Historical MSCI data and analysis should not be taken as an indication or guarantee of any future performance analysis, forecast or prediction. None of the MSCI data is intended to constitute investment advice or a recommendation to make (or refrain from making) any kind of investment decision and may not be relied on as such.
The broad market returns and factor returns used in our analysis were drawn from French Data Library, a research site maintained by Kenneth R. French, a finance professor at Dartmouth University and a noted academic researcher. Broad market returns for the U.S. Data were based on daily returns for a capitalization-weighted universe consisting of the U.S. common stocks listed on the New York Stock Exchange, the American Stock Exchange, and the Nasdaq market for which reliable price and return data are available. For the EAFE data, Morgan Stanley Capital International data was used from 1996 until 2006. Thereafter, Bloomberg provided the source data.
Factor returns were based on portfolios created from the stocks in the broad market universe ranked by the following factors:
For Value portfolios these were formed on Book-to-Market Value using the <0; bottom 30%, middle 40%, top 30%; quintiles; deciles.
Firms with negative book equity are in only the BE < 0 portfolio.
For Growth portfolios these were formed on Operating Profitability - bottom 30%, middle 40%, top 30%; quintiles; deciles.
For Return on Equity this was based on all the constituents of the relative indices’s.
For Beta this was based on portfolios formed on univariate market beta (ß) at the end of each June for each index.
For momentum six value-weight portfolios formed on size and prior (2-12) returns to construct Momentum.
For more details on the return methodology, please see the French Data Library, on the Web at http://mba.tuck.dartmouth.edu/pages/faculty/ken.french/data_library.html.
IMPORTANT INFORMATION
This material is being furnished for general informational and/or marketing purposes only. The material does not constitute or undertake to give advice of any nature, including fiduciary investment advice, nor is it intended to serve as the primary basis for an investment decision. Prospective investors are recommended to seek independent legal, financial and tax advice before making any investment decision. T. Rowe Price group of companies including T. Rowe Price Associates, Inc. and/or its affiliates receive revenue from T. Rowe Price investment products and services. Past performance is not a reliable indicator of future performance. The value of an investment and any income from it can go down as well as up. Investors may get back less than the amount invested.
The material does not constitute a distribution, an offer, an invitation, a personal or general recommendation or solicitation to sell or buy any securities in any jurisdiction or to conduct any particular investment activity. The material has not been reviewed by any regulatory authority in any jurisdiction.
Information and opinions presented have been obtained or derived from sources believed to be reliable and current; however, we cannot guarantee the sources' accuracy or completeness. There is no guarantee that any forecasts made will come to pass. The views contained herein are as of the date noted on the material and are subject to change without notice; these views may differ from those of other T. Rowe Price group companies and/or associates. Under no circumstances should the material, in whole or in part, be copied or redistributed without consent from T. Rowe Price.
The material is not intended for use by persons in jurisdictions which prohibit or restrict the distribution of the material and in certain countries the material is provided upon specific request.
It is not intended for distribution retail investors in any jurisdiction.
201911-1015991

RELATED FUND
SICAV
Class I
ISIN
LU0859255472
An actively managed, conviction-based global portfolio of around 80-100 attractively valued companies. We invest across the value spectrum, from deep value through to higher quality, more defensive companies, seeking to deliver positive excess returns regardless of which value substyle is currently favoured by the market. The fund is categorised as Article 8 under Sustainable Finance Disclosure Regulation (SFDR).
View More...
View more information on risks
FACTSHEET

Global Equities
Looking ahead to keep our clients on the right side of change