December 2022 / MARKETS & ECONOMY
A Closer Look at Quantitative Tightening Implications
While manageable near term, notable QT impact likely by mid-2023
Key Insights
- With the Fed shrinking its balance sheet, attention is again on the minimum level of reserves needed for short-term funding markets to operate smoothly.
- We believe that the point of minimum reserves is now higher than during the previous quantitative tightening (QT) cycle in 2017–2019.
- We think that policymakers risk running into financial stability concerns sooner than they appear to expect, potentially forcing the Fed to end its QT effort.
The Federal Reserve (Fed) has begun the process of shrinking its balance sheet by reducing its holdings of Treasury securities and agency mortgage-backed securities (MBS) by not reinvesting the proceeds from maturities. This process is known as quantitative tightening (QT). The previous time the Fed undertook a QT program was in 2017–2019, when the Fed’s balance sheet was about USD 4.5 trillion—it is almost double that figure now. That QT effort ended abruptly after bank reserves dropped below the minimum level needed to ensure smooth functioning of funding markets, driving a disruptive spike in short-term interest rates.
The Fed’s balance sheet has since grown substantially as the central bank launched a huge quantitative easing (QE) program to buy bonds and support the economy in response to the onset of the coronavirus pandemic. With the Fed now shrinking its balance sheet at nearly double the pace of 2017–2019, attention has once more turned to the minimum level of bank reserves needed to keep short-term funding markets operating smoothly. We believe that this point of minimum reserves is higher than during the previous QT cycle and that policymakers risk running into financial stability concerns sooner than they appear to expect, potentially forcing the Fed to end its QT effort.
What Is QT?
QT impacts both the assets and liabilities of the Fed’s balance sheet. Assets drop as the Fed stops reinvesting proceeds from maturing Treasury securities and agency MBS. The Fed is currently aiming to let up to USD 95 billion of assets (split between USD 60 billion of Treasuries and USD 35 billion of MBS) roll off its balance sheet every month from a starting total of nearly USD 9 trillion. The Fed announces the pace and composition of the decline in assets in advance.
A decline in assets must always be balanced with a decline in liabilities. Key liabilities for the Fed include:
- Bank reserves: checking account balances of commercial banks left at the Fed. The central bank pays an interest on reserve balances (IORB) rate to the commercial banks.
- Overnight reverse repo (ON/RRP): The Fed borrows cash (typically from money market funds) and lends Treasury securities as collateral, paying a rate that acts as a soft floor on money market rates.
Fed Has Less Control Over Balance Sheet Liabilities
While the Fed can control the decline in its assets, it has less control over the composition of liabilities that drain from its balance sheet. As a result, the QT process runs the risk that bank reserves drain faster than ON/RRP, causing reserves to breach the minimum level needed to ensure smooth functioning of funding markets.
The relationship between bank reserves and ON/RRP balances is, in part, determined by the willingness of holders of money to shift between leaving their money on deposit in banks or moving it to money market funds in search of a higher yield. As interest rates move higher, the rate paid on bank deposits tends to lag increases in the federal funds rate (which allows banks to benefit from higher rates), while money market funds reprice much faster—incentivizing flows out of the banking system and into money market funds. In turn, money market funds direct their inflows into the Fed’s ON/RRP facility.
Fed Slowly Reducing Its Balance Sheet
(Fig. 1) Total assets on the Fed’s balance sheet
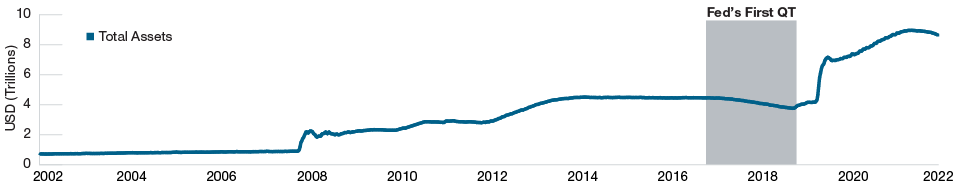
As of November 16, 2022.
Source: Board of Governors of the Federal Reserve System.
Fed Faces Challenge of Estimating Lowest Comfortable Level of Reserves
The challenge facing the Fed is that it cannot directly calculate this minimum level of reserves, known as the lowest comfortable level of reserves or LCLoR. Rather, the Fed surveys banks on the level of reserves they need to function, estimating that the LCLoR is around 8% of U.S. gross domestic product or approximately USD 2 trillion. For context, reserves in 2019 fell to about USD 1.5 trillion before short-term funding markets were disrupted—a level of reserves that was higher than survey results at the time suggested.
Since then, we believe that the LCLoR has moved higher for several reasons, including simple growth in the banking system as savings ballooned during the pandemic—the larger the overall banking system, the greater the amount of total reserves needed to meet regulatory requirements. Also, the expected deposit outflows from banks as customers shift from low-yield checking accounts to higher-yielding money market funds mean that banks would need higher precautionary liquidity buffers in the form of reserves.
Our projections show that the LCLoR is now closer to USD 2.5 trillion, which we estimate the Fed will approach in early to mid‑2023. However, we acknowledge that there is considerable uncertainty around this number. Most notably, the amount of bank reserves needed by the economy is an endogenous variable, meaning the Fed has the ability to adjust the pace of QT and use various tools to adjust the flow of bank reserves to extend the time period before reaching the LCLoR.
Fed Tries to Manage Reserves Drain
(Fig. 2) Central bank has less control over liabilities
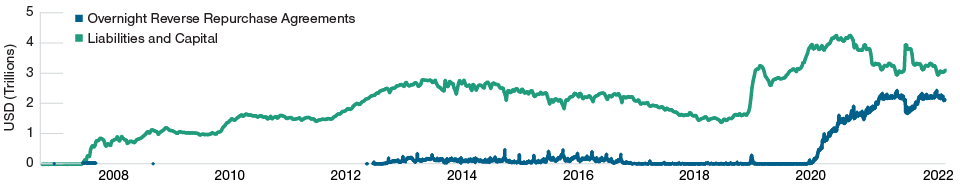
As of November 22, 2022.
Sources: Federal Reserve Bank of New York and Board of Governors of the Federal Reserve System.
Why Is This Important?
The Fed implements the decisions of the rate-setting Federal Open Market Committee (FOMC) by adjusting the total amount of bank reserves outstanding, aiming to balance the supply of and demand for reserves near the target fed funds rate. The IORB usually acts as the upper limit on the fed funds rate, and the ON/RRP rate is the lower bound. However, as the supply of reserves shrank in 2019 (the green vertical line in Figure 3 moved to the left), it started to hit the sloped portion of the demand curve for reserves (the blue line).
At that point, reserves start to become scarcer and funding costs begin to gently rise. If the green line moves too far to the left, funding costs begin to rise faster—which in late 2019 led to significant disruptions in funding markets. The Fed was forced to end QT at that time and begin buying Treasury bills to rebuild depleted reserves. It subsequently set up more permanent tools, such as the standing repo facility, which serves as a backstop when bank counterparties are unwilling to lend to help manage short-term interest rates.
Falling Reserves Can Cause Rate Spike
(Fig. 3) The level that would push rates higher is unclear
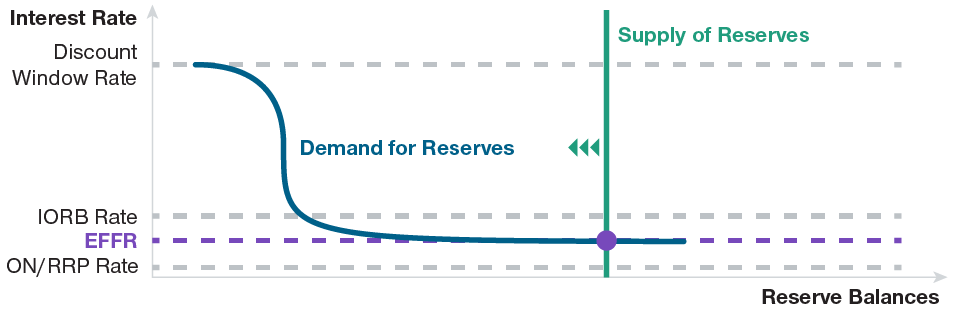
For illustrative purposes only.
EFFR = effective fed funds rate
Meaningful Chance of Early End to QT
Unlike 2019, when stress was largely confined to money markets, this time we believe that QT-related disruptions may appear in longer-term Treasury markets. The end of the Fed’s purchases and reduced bank buying, combined with increasingly poor Treasury market liquidity and fragmented market structure, may lead to heightened volatility in Treasuries.
As demonstrated in the UK in September and October, volatility in a country’s sovereign debt can rapidly lead to unpredictable consequences. We see a meaningful chance that the Fed could end its runoff-based QT early as a result of volatility that threatens financial stability, which could keep the central bank from moving into outright sales of its bond holdings.
What Are We Watching?
We are monitoring three key indicators to identify stress points as the QT program progresses:
- A narrowing in the spread between the effective fed funds rate and IORB, with fed funds eventually trading above IORB. This would be a sign that reserve balances have shrunk to the point where the demand curve for reserves starts to slope upward.
- Increased activity from domestic banks in the fed funds market could send a similar signal. This would indicate that these banks can earn a higher rate lending in the fed funds market than by leaving reserves at the Fed and earning IORB.
- Increased use of the Fed’s standing repo facility, which is intended to act as a ceiling for secured funding. The facility also provides a mechanism for the Fed to add reserves, but at an interest rate that is above the IORB.
What Are We Doing in Portfolios?
We are carefully monitoring risks around the ongoing decline in bank reserves, and in particular the risk that a major liquidity problem forces the Fed to end QT prematurely. One important potentially positive implication of QT ending early is that, in our view, financial stability risks are sufficient to keep the likelihood of outright sales of MBS by the Fed low. This removes the risk of heavier-than-expected supply of agency MBS, which supports our favorable view on the high-quality sector. Agency MBS have cheapened due to interest rate volatility and QT concerns. As these risks appear to be subsiding, along with prepayment risk due to the sharp rise in mortgage rates, we have been adding selectively in our taxable investment‑grade fixed income portfolios to take advantage of the sector’s attractive valuations and relatively good liquidity.
What We’re Watching Next
The Treasury Department has begun discussing the possibility of buying back longer-term Treasury notes from the market, funded by issuance of short-term bills. This could help alleviate upward pressure in short-term funding rates by introducing more Treasury bills that money market funds could buy, potentially drawing balances out of ON/RRP back into the banking system. Such a move could also help improve liquidity in the Treasury market, a critical piece of the global financial system, but reduced liquidity is only one of many factors that have contributed to 2022’s interest rate volatility.
IMPORTANT INFORMATION
This material is being furnished for general informational and/or marketing purposes only. The material does not constitute or undertake to give advice of any nature, including fiduciary investment advice, nor is it intended to serve as the primary basis for an investment decision. Prospective investors are recommended to seek independent legal, financial and tax advice before making any investment decision. T. Rowe Price group of companies including T. Rowe Price Associates, Inc. and/or its affiliates receive revenue from T. Rowe Price investment products and services. Past performance is not a reliable indicator of future performance. The value of an investment and any income from it can go down as well as up. Investors may get back less than the amount invested.
The material does not constitute a distribution, an offer, an invitation, a personal or general recommendation or solicitation to sell or buy any securities in any jurisdiction or to conduct any particular investment activity. The material has not been reviewed by any regulatory authority in any jurisdiction.
Information and opinions presented have been obtained or derived from sources believed to be reliable and current; however, we cannot guarantee the sources' accuracy or completeness. There is no guarantee that any forecasts made will come to pass. The views contained herein are as of the date noted on the material and are subject to change without notice; these views may differ from those of other T. Rowe Price group companies and/or associates. Under no circumstances should the material, in whole or in part, be copied or redistributed without consent from T. Rowe Price.
The material is not intended for use by persons in jurisdictions which prohibit or restrict the distribution of the material and in certain countries the material is provided upon specific request.
It is not intended for distribution to retail investors in any jurisdiction.