
February 2021 / INVESTMENT INSIGHTS
Three Critical Questions Facing Fixed Income Investors in 2021
Why a flexible approach is necessary in this challenging environment
Key Insights
- The current bond market landscape raises serious questions for investors about fixed income diversification power, return potential, and liquidity profile.
- Potential for greater volatility in government bond prices, particularly at the long end of curves, is likely to require a more flexible approach.
- The Dynamic Global Bond Strategy successfully navigated the volatility and large price swings witnessed in 2020 to deliver, in our view, its objectives of regular returns, downside control, and diversification.
While a new year may be underway, at least one thing remains the same: low bond yields. We believe that the challenges and risks this environment presents may not be fully understood by investors. For that reason, we have identified three questions that we believe investors should consider: focusing on the diversification power of bonds, their performance potential, and their liquidity profile for 2021.
Diversification—Do Bonds Still Deliver Diversification Benefits?
Traditionally, fixed income has been a diversifying asset class that typically performs well when risk markets such as equities sell off. This means that bonds have often been used by investors as risk mitigation to keep portfolios balanced. However, many are questioning whether this approach is still as effective with bond yields so low—and with good reason. In the first quarter of 2020, the main German stock index fell 25%,1 but German bunds2 only rose 2%, indicating that the diversification power of bonds may be much less potent in the current low interest rate environment. If this is the case, it follows that government bonds should no longer be the sole risk mitigation tool for investors and that finding new sources of diversification should be a priority in 2021. We believe that this will require a portfolio construction that is more agile and uses relative value positioning, volatility trading‑based instruments, and in‑depth research to benefit from potential decorrelated opportunities.
Performance Table
(Fig. 1) Performance of the Dynamic Global Bond (USD Hedged) Composite versus Three‑month LIBOR in USD

As of December 31, 2020. Figures are calculated in U.S. dollars.
Past performance is not a reliable indicator of future performance.
The Value Added row is shown as Dynamic Global Bond (USD Hedged) Composite performance (Gross of Fees) minus the benchmark in the previous row. Gross performance returns are presented before management and all other fees, where applicable, but after trading expenses. Net‑of‑fees performance reflects the deduction of the highest applicable management fee that would be charged based on the fee schedule contained within this material, without the benefit of breakpoints. Gross and net performance returns reflect the reinvestment of dividends and are net of all non‑reclaimable withholding taxes on dividends, interest income, and capital gains.
Source: T. Rowe Price.
Yields—Where Next for Rock‑Bottom Bond Yields?
The aggressive monetary policy actions of central banks have pushed bond yields down to historic low levels. Given ongoing uncertainties surrounding the pandemic, further moves lower in yields should not be ruled out. However, the biggest shifts are likely to be behind us now. The yield on the two‑year U.S. Treasury bond, for example, ended 2020 at 0.12%—which is already within the fed fund’s target rate range of between zero and 0.25%. It was a similar story in other core markets, such as Japan and Germany, at the end of 2020.
While central banks are unlikely to raise interest rates in the near future, the prospect of some sort of tapering should not be completely disregarded, especially if a rebound in economic conditions leads to inflation picking up. The pressure on yields could be exacerbated further should governments start to signal plans to loosen fiscal policy further after unprecedented spending during the pandemic. Against this backdrop, there is the potential for greater volatility in government bond prices, particularly at the long end of curves. We believe that active yield curve management will, therefore, be important in 2021, as will the ability to make dramatic shifts in duration posture. Inflation‑linked bonds may also prove beneficial this year.
Liquidity—What Is Liquid in Your Portfolio?
In March 2020, we witnessed the first real collapse in liquidity conditions since the global financial crisis. It started with credit markets, and eventually, every segment of the bond market was affected, with price dislocation even occurring in some parts of the U.S. Treasury market at the height of the crunch. This episode provided a stark reminder that liquidity is rarely present when it is needed and that it is always important to undertake a forensic analysis of the liquidity profile of fixed income under different market environments.
Furthermore, the March experience raises the question of which securities and sectors will be considered liquid in the future. In our view, liquidity currently needs to be found elsewhere— for example, from currency markets and derivative instruments such as synthetic credit indices, which both provided liquidity while other assets struggled during 2020. Accordingly, we have increased our exposure to both. Increasing the use of option positions could also offer an opportunity to exploit sudden moves in volatility in 2021.
Quarterly Performance Breakdown
(Fig. 2) Quarterly Performance of the Dynamic Global Bond (USD Hedged) Composite Gross of Fees Versus Three‑Month LIBOR in USD
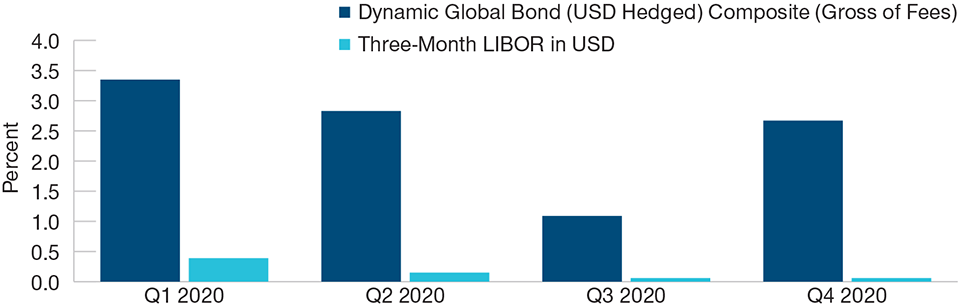
As of December 31, 2020. Figures are calculated in U.S. dollars.
Past performance is not a reliable indicator of future performance.
Gross performance returns are presented before management and all other fees, where applicable, but after trading expenses. Gross performance returns reflect the reinvestment of dividends and are net of all non‑reclaimable withholding taxes on dividends, interest income, and capital gains.
Source: T. Rowe Price.
How Our Absolute Return Approach May Help in This Environment
To navigate some of the challenges highlighted by the three questions listed above, we believe that a flexible approach could help. In the Dynamic Global Bond Strategy, we have three clear objectives that we seek to achieve:
1. Regular Return
Aims to generate consistent and sustainable performance from coupon income and capital gains. Diversification across geography and markets is important—we benefit from a large global research platform that is the engine powering our investment ideas. Covering more than 80 countries, 40 currencies, and 15 sectors, our deep research capabilities enable us to uncover inefficiencies and potentially exploit opportunities across the full fixed income investable base. But we do so in a disciplined way—managing risk is very important to us. We devote significant efforts to the analysis and monitoring of risk of each individual investment position, as well as the overall level of risk borne by the portfolio.
2. Capital Preservation and Downside Risk Management
Aims to minimize losses and preserve capital through managing downside risks, such as a potential rise in interest rates. We have wide latitude to manage overall duration, which gives us the flexibility to adapt rapidly to different market environments and cycles, especially since our approach displays a high‑quality profile. When interest rates are rising, for example, we can cut duration to as low as minus one year in seeking to minimize potential losses, using instruments such as fixed income futures and interest rate swaps. By contrast, when rates are falling, we can increase duration to as high as six years to maximize potential gains. A good example of our tactical duration management was 2020. After kicking off the year with the portfolio’s overall duration in negative territory, we quickly pivoted in February and significantly increased duration as the coronavirus situation escalated. The changes made, particularly moving from a short duration to a long position in U.S. duration, helped the strategy’s composite deliver a positive performance in the first quarter at a time when many other bond investors struggled.
3. Diversification Away From Risky Markets
Aims to be a performance anchor during times of equity and risk market corrections. To help do this, we implement a number of defensive hedging positions, such as short positions on emerging market currencies, allocation to markets displaying defensive characteristics, or going long volatility through options, so that during periods of market turbulence, we could benefit from price falls of risky assets. We also have a high‑quality bias—investing a large portion of our portfolio in high‑quality and less volatile government bond markets where liquidity is typically better. This helps us to be dynamic and adapt quickly to changes in market conditions. It also gives us latitude to take advantage of possible pricing anomalies and dislocations that might occur, as in March 2020, when a huge sell‑off in credit opened up a good opportunity to add select exposure at cheap prices. When it comes to credit, it’s important to understand that we don’t just buy and hold—exposures are managed actively. The best ideas are selected from our global research platform; then to try to help remove some of the credit beta, we typically utilize derivative instruments. This allows us to invest specifically in the position’s alpha potential.
2020 at a Glance

Future positioning and responses may differ, perhaps significantly.
2020—An Important Test of Our Approach
Through all the volatility and different market environments of 2020, the Dynamic Global Bond (USD Hedged) Composite delivered a strong positive return compared to the Three‑Month LIBOR (USD) during every single quarter. The year was an important test of our approach, and we believe we delivered for our clients what we set out to do—provide regular returns, capital preservation, and diversification away from risk markets.
Looking ahead to this year, there are four themes that currently underpin the bullish tone in financial markets: ultra‑accommodative monetary policy, expansionary fiscal policy, significant pent‑up demand for services, and expectations that vaccines introduce a return to a more normal life.
As long as these themes continue, the positive tone underpinning markets is likely to remain in place. On our side, we will continue to follow our rigorous investment process and strive to maintain a portfolio that strikes a balance between country, duration, and yield curve positioning to take advantage of relative value opportunities globally while also managing downside risks. We believe that flexibility will be key in 2021, which is conducive to our strategy as we have the ability to be nimble and adapt quickly to changes in market conditions.
GIPS® COMPOSITE REPORT
Dynamic Global Bond (USD Hedged) Composite
Period Ended December 31, 2019
Figures Are Shown in U.S. dollar

1 Reflects deduction of highest applicable fee schedule without benefit of breakpoints. Investment return and principal value will vary. Past performance is not a reliable indicator of future performance. Monthly composite performance is available upon request. See below for further information related to net of fee calculations.
2 January 31, 2015 through December 31, 2015.
3 Preliminary—subject to adjustment.
T. Rowe Price (TRP) has prepared and presented this report in compliance with the Global Investment Performance Standards (GIPS®). TRP has been independently verified for the 23‑year period ended June 30, 2019 by KPMG LLP. The verification report is available upon request. Verification assesses whether (1) the firm has complied with all the composite construction requirements of the GIPS standards on a firm‑wide basis and (2) the firm’s policies and procedures are designed to calculate and present performance in compliance with the GIPS standards. Verification does not ensure the accuracy of any specific composite presentation.
TRP is a U.S. investment management firm with various investment advisers registered with the U.S. Securities and Exchange Commission, the U.K. Financial Conduct Authority, and other regulatory bodies in various countries and holds itself out as such to potential clients for GIPS purposes. TRP further defines itself under GIPS as a discretionary investment manager providing services primarily to institutional clients with regard to various mandates, which include U.S., international, and global strategies but excluding the services of the Private Asset Management group. The minimum asset level for equity portfolios to be included in composites is $5 million and prior to January 2002 the minimum was $1 million. The minimum asset level for fixed income and asset allocation portfolios to be included in composites is $10 million; prior to October 2004 the minimum was $5 million; and prior to January 2002 the minimum was $1 million. Valuations are computed in U.S. dollars.
Gross performance returns are presented before management and all other fees, where applicable, but after trading expenses. Net of fees performance reflects the deduction of the highest applicable management fee that would be charged based on the fee schedule contained within this material, without the benefit of breakpoints. Gross and net performance returns the reinvestment of dividends and are net of nonreclaimable withholding taxes on dividends, interest income, and capital gains. Effective June 30, 2013, portfolio valuation and assets under management are calculated based on the closing price of the security in its respective market. Previously portfolios holding international securities may have been adjusted for after‑market events. Policies for valuing portfolios, calculating performance, and preparing compliant presentations are available upon request. Dispersion is measured by the standard deviation across asset‑weighted portfolio returns represented within a composite for the full year. Dispersion is not calculated for the composites in which there are five or fewer portfolios.
The strategy utilizes on a regular basis a variety of derivative instruments such as (but not limited to) currency forwards, fixed income futures, interest rate swaps, credit default swaps, synthetic indices, and options on all mentioned instruments, primarily to hedge certain market risks associated with the strategy’s objective, to express directional opportunities on specific markets and to facilitate liquiditymanagement. Benchmarks are taken from published sources and may have different calculation methodologies, pricing times, and foreign exchange sources from thecomposite. Composite policy requires the temporary removal of any portfolio incurring a client initiated significant cash inflow or outflow greater than or equal to 15% of portfolio assets. The temporary removal of such anaccount occurs at the beginning of the measurement period in which the significant cash flow occurs and the account re‑enters the composite on the last day of the current month after the cash flow. Additional information regarding the treatment of significant cash flows is available upon request.
The firm’s list of composite descriptions and/or a presentation that adheres to the GIPS® standards are available upon request.
Fee Schedule

1A transitional credit is applied to the fee schedule as assets approach or fall below the breakpoint.
Risks—the following risks are materially relevant to the portfolio:
ABS/MBS risk—These securities may be subject to greater liquidity, credit, default and interest rate risk compared to other bonds. They are often exposed to extension and prepayment risk.
China Interbank Bond Market risk—market volatility and potential lack of liquidity due to low trading volume of certain debt securities in the China Interbank Bond Market may result in prices of certain debt securities traded on such market fluctuating significantly.
Contingent convertible bond risk—contingent convertible bonds have similar characteristics to convertible bonds with the main exception that their conversion is subject to predetermined conditions referred to as trigger events usually set to capital ratio and which vary from one issue to the other.
Country risk (China)—all investments in China are subject to risks similar to those for other emerging markets investments. In addition, investments that are purchased or held in connection with a QFII licence or the Stock Connect program may be subject to additional risks.
Country risk (Russia and Ukraine)—in these countries, risks associated with custody, counterparties and market volatility are higher than in developed countries.
Credit risk—a bond or money market security could lose value if the issuer’s financial health deteriorates.
Currency risk—changes in currency exchange rates could reduce investment gains or increase investment losses.
Default risk—the issuers of certain bonds could become unable to make payments on their bonds.
Derivatives risk—derivatives may result in losses that are significantly greater than the cost of the derivative.
Emerging markets risk—emerging markets are less established than developed markets and therefore involve higher risks.
High yield bond risk—a bond or debt security rated below BBB- by Standard & Poor’s or an equivalent rating, also termed “below investment grade, is generally subject to higher yields but to greater risks too.
Interest rate risk—when interest rates rise, bond values generally fall. This risk is generally greater the longer the maturity of a bond investment and the higher its credit quality.
Issuer concentration risk—to the extent that a portfolio invests a large portion of its assets in securities from a relatively small number of issuers, its performance will be more strongly affected by events affecting those issuers.
Liquidity risk—any security could become hard to value or to sell at a desired time and price.
Prepayment and extension risk—with mortgage and asset-backed securities, or any other securities whose market prices typically reflect the assumption that the securities will be paid off before maturity, any unexpected behavior in interest rates could impact portfolio performance.
Sector concentration risk—the performance of a portfolio that invests a large portion of its assets in a particular economic sector (or, for bond portfolio, a particular market segment), will be more strongly affected by events affecting that sector or segment of the fixed income market.
General Portfolio Risks
Capital risk—the value of your investment will vary and is not guaranteed. It will be affected by changes in the exchange rate between the base currency of the portfolio and the currency in which you subscribed, if different.
Counterparty risk—an entity with which the portfolio transacts may not meet its obligations to the portfolio.
Geographic concentration risk—to the extent that a portfolio invests a large portion of its assets in a particular geographic area, its performance will be more strongly affected by events within that area.
Hedging risk—a portfolio’s attempts to reduce or eliminate certain risks through hedging may not work as intended.
Investment portfolio risk—investing in portfolios involves certain risks an investor would not face if investing in markets directly.
Management risk—the investment manager or its designees may at times find their obligations to a portfolio to be in conflict with their obligations to other investment portfolios they manage (although in such cases, all portfolios will be dealt with equitably).
Operational risk—operational failures could lead to disruptions of portfolio operations or financial losses.
IMPORTANT INFORMATION
This material is being furnished for general informational and/or marketing purposes only. The material does not constitute or undertake to give advice of any nature, including fiduciary investment advice, nor is it intended to serve as the primary basis for an investment decision. Prospective investors are recommended to seek independent legal, financial and tax advice before making any investment decision. T. Rowe Price group of companies including T. Rowe Price Associates, Inc. and/or its affiliates receive revenue from T. Rowe Price investment products and services. Past performance is not a reliable indicator of future performance. The value of an investment and any income from it can go down as well as up. Investors may get back less than the amount invested.
The material does not constitute a distribution, an offer, an invitation, a personal or general recommendation or solicitation to sell or buy any securities in any jurisdiction or to conduct any particular investment activity. The material has not been reviewed by any regulatory authority in any jurisdiction.
Information and opinions presented have been obtained or derived from sources believed to be reliable and current; however, we cannot guarantee the sources' accuracy or completeness. There is no guarantee that any forecasts made will come to pass. The views contained herein are as of the date noted on the material and are subject to change without notice; these views may differ from those of other T. Rowe Price group companies and/or associates. Under no circumstances should the material, in whole or in part, be copied or redistributed without consent from T. Rowe Price.
The material is not intended for use by persons in jurisdictions which prohibit or restrict the distribution of the material and in certain countries the material is provided upon specific request.
It is not intended for distribution retail investors in any jurisdiction.
