October 2026, Alternatives
Historically, real assets have included cell towers, power plants and transportation infrastructure such as ports, bridges and tunnels. Ongoing transformational growth in areas such as data centers, digital grid densification and replacing aging infrastructure are significantly expanding long term capital needs in these markets. These assets are mission critical to the operation of the broader physical and digital economy. OHA considers financing solutions for these types of assets examples of real asset credit.
OHA believes the opportunity set for infrastructure investment is rapidly expanding with an estimated $100+ trillion need for capital over the next decade.2 Record private equity dry powder and bank retrenchment from infrastructure assets create a significant funding gap for private infrastructure credit to fill.3
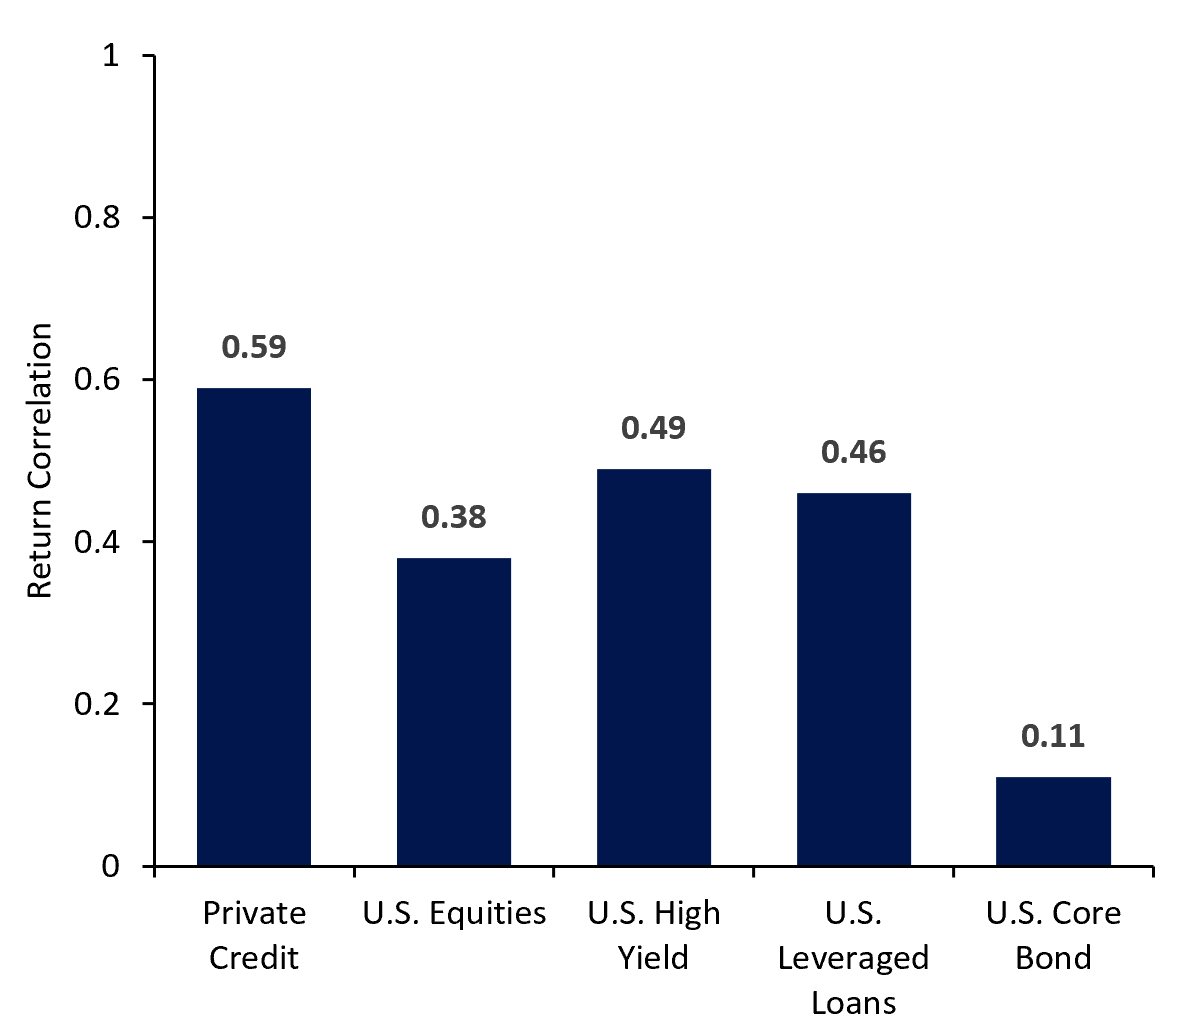
OHA believes real asset credit offers attractive risk-adjusted returns with downside protection supported by underlying durable cash flows and long-term contracts. Return streams are typically uncorrelated to other asset classes due to limited sensitivity to market and interest rate cycles. Figure 1 shows the low correlation of infrastructure credit compared to other major asset classes.
OHA believes that several features of real asset credit, particularly infrastructure credit, position the asset class to generate attractive risk-adjusted returns that complement existing traditional and alternative asset allocations. OHA seeks to target these investment characteristics when evaluating real asset credit investments.
Real assets credit is a large and evolving asset class offering significant potential for manager differentiation. OHA focuses on customized financing solutions for high-quality real assets in developed markets where it has a competitive edge.
| High-caliber, well-capitalized owners & developers with meaningful equity commitments |
Developed Markets North America and Western Europe – creditor-friendly jurisdictions |
Large-scale businesses / projects institutional-quality scale6 |
| Proven technologies no adoption risk |
Established management teams with proven track records |
Low correlation to broader economy essential-service revenues |
| Nascent technologies unproven performance or adoption |
Emerging markets jurisdictional & enforcement risks |
Complex construction risk cost, timeline & completion exposure |
| Consumer risk credit cards, auto loans, etc. |
Forward flow / Asset based financial-style risk high-velocity origination models |
Real Estate offices, hotels and other vacancy-driven risk |
Jun 2026
Alternatives
For wholesale clients only. Not for retail distribution. All numbers in USD, unless specified.
Appendix and Endnotes
1 Source: OHA analysis as of December 31, 2025. Correlations are based on total return and include the reinvestment of dividends and interest. Infrastructure Credit represented by the Preqin Global Infrastructure Debt Closed-End Fund Index. Private Credit represented by the Cliffwater Direct Lending Index. U.S. Equities represented by the S&P 500 Index. U.S. High Yield represented by the ICE BofA US High Yield Index. U.S. Leveraged Loans represented by the S&P UBS Leveraged Loan Index. U.S. Core Bond represented by the Bloomberg US Aggregate Index. An investor cannot invest directly in an index.
a)Index Definitions:
i.The Preqin Global Infrastructure Debt Closed-End Fund Index is a reporting-grade market reference benchmark that tracks the net performance of closed-end, unlisted private infrastructure debt funds from the perspective of limited partners (LPs).
ii.The Cliffwater Direct Lending Index (“CDLI”) seeks to measure the unlevered, gross of fees performance of U.S. middle market corporate loans, as represented by the underlying assets of Business Development Companies (“BDCs”), including both exchange-traded and unlisted BDCs, subject to certain eligibility criteria.
iii.S&P 500 Index is a stock market benchmark that tracks the performance of 500 of the largest publicly traded companies in the United States.
iv.The ICE BofA US High Yield Index tracks the performance of U.S. dollar-denominated, below-investment-grade corporate debt publicly issued in the U.S. domestic market.
v.The S&P UBS Leveraged Loan Index measures the market-value-weighted performance of the investable universe of USD-denominated leveraged loans.
vi.The Bloomberg US Aggregate Bond Index is a broad-based flagship benchmark that measures the investment grade, US dollar denominated, fixed-rate taxable bond market.
2 Represents estimated infrastructure investment projected spend through 2040. Source: McKinsey & Company: The infrastructure moment. As of September 2025.
3 Source: MetLife Investment Management / Markets Group (Nov 2025). Infrastructure Debt—Understanding the Opportunity.pdf and IJ Global, Infrastructure and Project Finance League Table Report H1 2025 (Infrastructure and Project Finance Charts) and Preqin as of December 31, 2025.
4 The criteria described are neither a guarantee nor prediction of the investment opportunities available for investment and the opportunities that OHA participates in may differ, potentially materially, from the investment criteria described herein. Real assets are subject to significant economic, market and other uncertainties that may adversely affect the investment opportunities available and the reader should not assume that investments were or will be profitable.
5 Equity cushion is the value of an asset that absorbs losses before debt holders.
6 OHA seeks to provide the same type of investment solution to individual investors that were previously largely only available to OHA’s institutional clients. Institutional clients may invest in products on substantially different terms and conditions than those offered to individual investors.
Key Risks and Disclosures
All investments are subject to market risk, including the possible loss of principal. Some or all alternative investments may not be suitable for certain investors. No assurance can be given that a fund’s investment objectives will be achieved. Alternative investments are speculative and involve a substantial degree of risk. Opportunities for withdrawal/redemption and transferability of interests are generally restricted, so investors may not have access to capital when it is needed. Any investor who subscribes, or proposes to subscribe, for an investment in a fund or separately managed account must be able to bear the risks involved and must meet relevant suitability requirements. In addition, the fees and expenses charged may be higher than the fees and expenses of other investment alternatives, which will reduce profits.
Fixed-income securities are subject to credit risk, liquidity risk, call risk, and interest-rate risk. As interest rates rise, bond prices generally fall. Investments in high yield bonds involve greater risk of price volatility, illiquidity, and default than higher-rated debt securities. International investments can be riskier than U.S. investments due to the adverse effects of currency exchange rates, differences in market structure and liquidity, as well as specific country, regional, and economic developments.
Important Information
All opinions and estimates are based on assumptions, all of which are difficult to predict and many of which are beyond the control of OHA. In preparing this document, OHA has relied upon and assumed, without independent verification, the accuracy and completeness of all information. OHA believes that the information provided herein is reliable; however, it does not warrant its accuracy or completeness. All charts and tables are shown for illustrative purposes only.
This material is being furnished for general informational purposes only. The material does not constitute or undertake to give advice of any nature, including fiduciary investment advice. Prospective investors are recommended to seek independent legal, financial and tax advice before making any investment decision. T. Rowe Price group of companies including T. Rowe Price Associates, Inc. and/or its affiliates receive revenue from T. Rowe Price investment products and services. Past performance is not a guarantee or a reliable indicator of future results. The value of an investment and any income from it can go down as well as up. Investors may get back less than the amount invested.
The material does not constitute a distribution, an offer, an invitation, a personal or general recommendation or solicitation to sell or buy any securities in any jurisdiction or to conduct any particular investment activity. The material has not been reviewed by any regulatory authority in any jurisdiction.
Information and opinions presented have been obtained or derived from sources believed to be reliable and current; however, we cannot guarantee the sources' accuracy or completeness. There is no guarantee that any forecasts made will come to pass. The views contained herein are as of 30 September 2026 and are subject to change without notice; these views may differ from those of other T. Rowe Price group companies and/or associates. Under no circumstances should the material, in whole or in part, be copied or redistributed without consent from T. Rowe Price.
The material is not intended for use by persons in jurisdictions which prohibit or restrict the distribution of the material and in certain countries the material is provided upon specific request.
It is not intended for distribution to retail investors in any jurisdiction.
Issued in Australia by Oak Hill Advisors (Australia) Pty. Ltd (ABN: 61 150 344 933 and AFSL: 415209), Level 28, Governor Phillip Tower, 1 Farrer Place, Sydney NSW 2000, Australia. For Wholesale Clients only,
OHA is a T. Rowe Price company.
© 2026 Oak Hill Advisors. All Rights Reserved. OHA is a trademark of Oak Hill Advisors, L.P. All other trademarks shown are the property of their respective owners. Use does not imply endorsement, sponsorship, or affiliation of Oak Hill Advisors with any of the trademark owners.