Put the power of curiosity behind your investments
We ask smart questions to uncover investment opportunities.
Curiosity drives confident investing
Stand out with us. Here's what sets us apart.
89 years and $1.89 trillion in assets under management
Discover the benefits of working with a premier global asset manager—focused on client success since 1937.

Our curiosity uncovers opportunities others might miss
Asking better questions pushes us to dig deeper, conduct more rigorous research, and manage risk. Giving you sharper insights and an investment edge.

We delivered better returns, outperforming passive competitors
Curiosity keeps us focused on finding long-term opportunities—and delivering better returns for you over many market cycles.
Read more below
Smart questions drive deeper partnership with you
We work to understand you, your challenges, and your goals, so our advice can help you navigate change and achieve better outcomes.
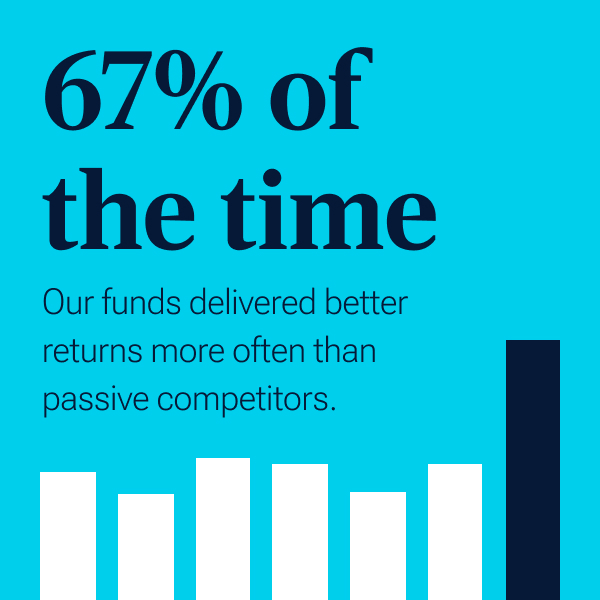
Our curiosity delivered better returns, more often
Boost your investment potential. We’re committed to our clients’ success. That’s why we maintain a long-term view as we aim to deliver consistently strong performance for investors in up and down markets.
T. Rowe Price funds beat passive competitors more frequently—and with higher average returns.1
10-year trailing periods, rolling monthly. Period analyzed is 20 years ended December 31, 2025. Results are net of fees.

For more information on the methodology of this analysis, please visit troweprice.com/complete-performance-study
Choose your path to confident investing with us
Personal Investing
I want to explore mutual funds, roll over my 401(k), save for college, get investment advice or open a new account.
Financial Advisors / Intermediaries
I'm a broker-dealer, registered investment advisor, DC–focused advisor, or trust or bank financial professional.
Institutional Investors / Consultants
I'm an institutional investor or consultant looking to review investment strategies and discover timely insights.
Capabilities to meet a full range of investor needs
Asset class figures and retirement percentage shown represent total assets under management of $1.89 trillion as of June 30, 2026. All amounts shown in U.S. dollars and subject to adjustment.
Equity
$919B
Fixed Income
$222B
Multi-Asset
$690B
Alternatives
$62B
Retirement assets are 67% of AUM
Tune in. Fuel for your investment decisions.
Award-winning podcasts. Better questions. Better insights. Hear our best thinking on markets, investing, and retirement.

CONFIDENT CONVERSATIONS® on Retirement
This original podcast equips you with knowledge, tools, and confidence to create the future you imagine. For 40 years, T. Rowe Price has been asking questions to gain a deep understanding of investors’ retirement challenges and goals.

The Angle from T. Rowe Price
The Angle podcast brings you sharp insights on the forces shaping financial markets. With dynamic perspectives from the T. Rowe Price global investing team and special guests, curious investors can gain an information edge on today’s evolving market themes.
Important Information
The performance data shown is past performance and is no guarantee of future results. All investments are subject to risk, including the possible loss of principal. Results from other time periods may differ. Active investing may have higher costs than passive investing and may underperform the broad market or passive peers with similar objectives. Passive investing may lag the performance of actively managed peers as holdings are not reallocated based on changes in market conditions or outlooks on specific securities.
Analysis by T. Rowe Price. Comparable passive funds are (1) mutual funds and exchange-traded funds (ETFs) classified as an “index fund” in the Morningstar Direct database and (2) in the same Morningstar category as the active funds being analyzed. All Active Managers represents the actively managed (non-“index fund”) mutual funds and ETFs in the Morningstar Direct database, excluding those managed by T. Rowe Price. The performance of the T. Rowe Price active funds and the All Active Managers funds were compared against the comparable passive funds using 10- year rolling monthly periods from 1/1/06 to 12/31/25. The analysis was conducted at the Morningstar category level analyzing all open-end funds and ETFs within U.S. Morningstar categories where passive funds are present. Oldest share class returns are used for analysis. Money market funds are excluded from the analysis.
(1) 116 funds covering 9,844 rolling 10-year periods.
Call 1-800-225-5132 to request a prospectus or summary prospectus; each includes investment objectives, risks, fees, expenses, and other information that you should read and consider carefully before investing.
T. Rowe Price Investment Services, Inc., distributor, T. Rowe Price funds.
4607782