
February 2022 / GLOBAL FIXED INCOME
Helping Global Bond Investors When Duration Fails
Strategies to reduce potential duration-led losses.
Key Insights
- Global bond investors could face significant risks from rising yields in 2022 and long duration portfolio holdings. Many seek ways to mitigate these risks.
- Our studies suggests lowering duration on government bond portfolios to around two years may significantly reduce or even prevent losses from rising yields.
- An alternative option would be to adopt an unconstrained global bond portfolio, giving the manager full discretion over both country and duration strategy.
Many fixed income investors have been asking about the implications of rising interest rates, especially now that markets are beginning to discount the first rate hikes by the U.S. Federal Reserve earlier than had seemed likely a few months ago. While the Fed initially saw the emergence of post coronavirus pandemic inflation as transitory, the increase in prices has been far more persistent than they had earlier hoped for. This led Fed Chair Jerome Powell recently to say it was time to retire the term “transitory” as a description of current inflation. Even if inflation falls back to 3% to 4% per cent, it may be a long time before it is back at the Fed’s 2% per cent target.
In the current environment, index-aware global bond investors face significant risks posed by a combination of rising market yields in 2022 and long duration portfolio holdings. They have become increasingly concerned over their exposure to rising rates, how quickly rates will rise, and just how large the potential drawdown on a portfolio of global government bonds might be. In this Insights note, we try to address some of these key concerns, in particular what can be done to mitigate the risks from rising rates.
We believe that one possible solution is for investors to take steps to mitigate potential duration-led losses ahead of any major upward move in yields. To succeed in this, decisive action will be required by asset owners to ensure that their fixed income managers have the flexibility they need to manage duration risk more aggressively in the elevated inflation, rising yield environment that beckons in 2022.
One way to acquire some insights into the potential risks is to look at scenario tests based on past periods of rising bond yields. For a scenario approach to be successful, a relatively reliable model of monthly bond returns appears essential. Fortunately, such a model is feasible, based on a three-factor approach to estimating total returns, namely the initial yield, duration, and roll-down return. Such a model is described later in the paper.
Evolution of The Global Treasury Market Since 1987
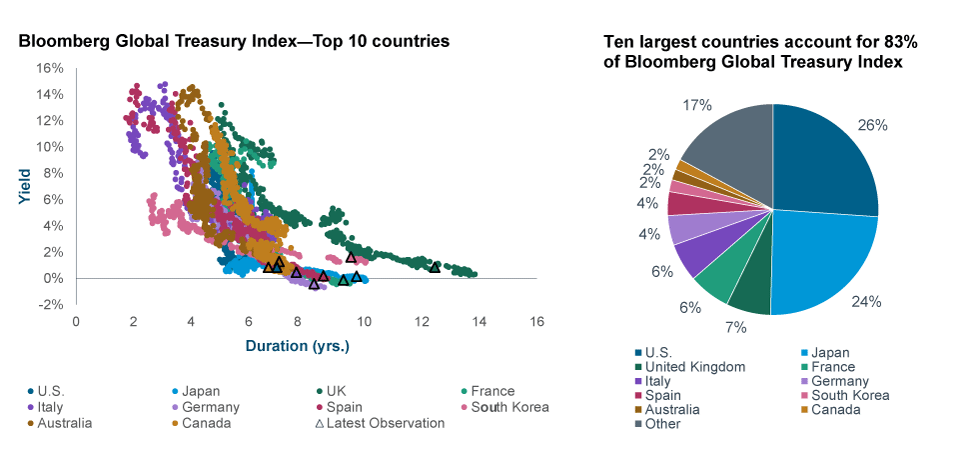
(Fig. 1) Bloomberg Global Treasury Index—Top 10 countries
Past performance is not a reliable indicator of future performance.
As of February 26, 2021.
Source for Bloomberg index data: Bloomberg Index Services Limited. See Additional Disclosures. Analysis by T. Rowe Price. Indexes referred to: Bloomberg Global Treasury—US Treasury, Bloomberg Global Treasury—Japan, Bloomberg Global Treasury—United Kingdom, Bloomberg Global Treasury—France, Bloomberg Global Treasury—Italy, Bloomberg Global Treasury—Germany, Bloomberg Global Treasury—Spain, Bloomberg Global Treasury—South Korea, Bloomberg Global Treasury—Australia, Bloomberg Global Treasury—Canada. (All local returns.)
By way of historical background, Figure 1 charts yield versus duration for the top 10 government bond markets included in the Bloomberg Global Treasury Index from February 1987. In terms of market share, the U.S. and Japan each account for around 25% of the global total while the top 10 markets combined have a share of over 83% and, so, will clearly be the major drivers of global government yields. Figure 1 shows that, in every case, the trend in government bond yields over the past 30-plus years has been lower, while the trend in duration has been higher. The triangular observations shown are for February 2021. We can see from Figure 1 that nominal yields are close to historic lows, and, in some cases, yields are even negative.
This observation is very important for fixed income investors, since over medium-to longer-term horizons, the total return from government bonds tends to be close to their initial yields. This suggests that in the current environment, global bond investors should be conservative in terms of their future return expectations. The nature and importance of the initial yield-to-total return relationship is worth elaborating further.
Initial Yield and Subsequent Total Bond Returns
That the initial or purchase yield can explain much of the subsequent long-term total bond return is well known. Taking the U.S. Treasury bond market as an example, the relationship is clearly visible in Figure 2.
“Yield” as a Driver of U.S. Treasury Returns
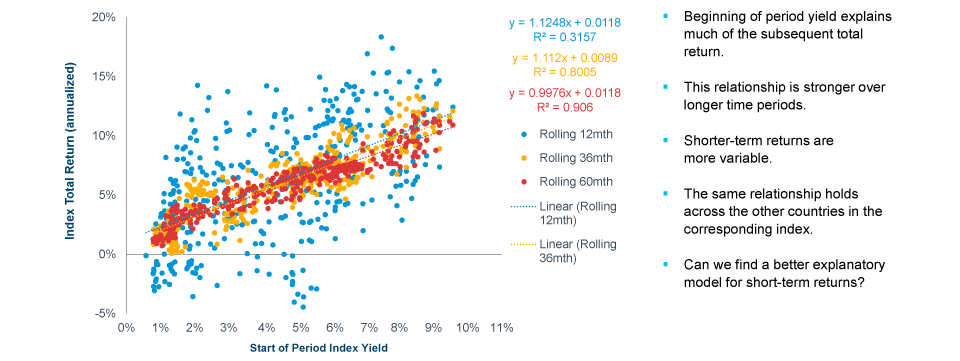
(Fig. 2) U.S. Treasury Index—total returns vs. starting period yield
Data from January 1, 1987, to February 26, 2021. For illustrative purposes only.
Past performance is not a reliable indicator of future performance.
Source for Bloomberg index data: Bloomberg Index Services Limited. See Additional Disclosures. Analysis by T. Rowe Price. Index referred to: Bloomberg Global Treasury—US Treasury (local return).
Here, the red dots represent rolling 60-month or five year returns, and there is quite a tight upward-sloping relationship with the starting period yield measured on the horizontal axis. The goodness of fit (R²) for our sample period is high at 0.906. On reducing the time horizon to three years (the yellow dots in Figure 2), there is still a clear relationship, with an R² of 0.8005. But if we reduce the time horizon further to rolling 12-month periods (the blue dots), the relationship is greatly weakened as the goodness of fit, or R2, falls to 0.316. In other words, only about 32% of the 12-month bond return can be explained by the yield at purchase.
So the key thing to understand from Figure 1 is that the yield you invest at will likely prove a very close proxy for the total return over five years. But over shorter holding periods of 12 months or less, there is only the loosest of relationships as observations in the scatterplot (the blue dots) are highly dispersed. The reason for this is that there are other important factors at work in the determination of short-term bond returns, notably duration return (related to the interest rate sensitivity of the portfolio) and roll-down return (a function of the shape of the yield curve slope).
A Statistical Model of Monthly Bond Returns
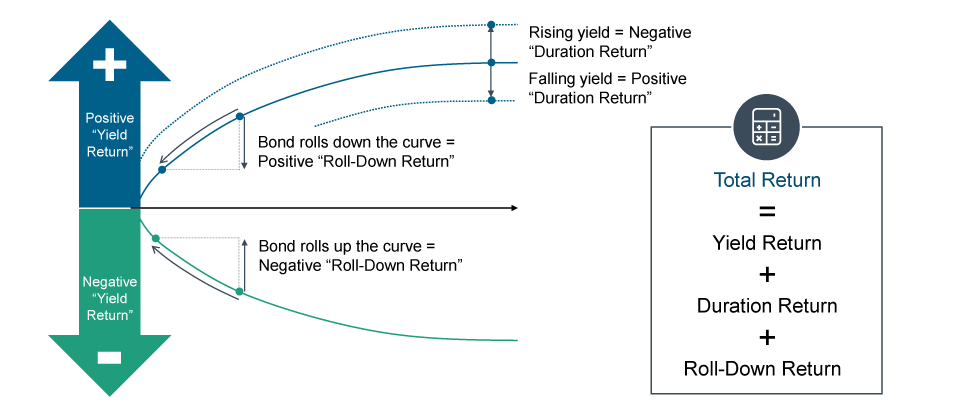
We constructed a simple model of Treasury bond returns by taking data based on standard formulas for the three main sources of return—yield, duration and roll down. Yield is the return that accrues from just holding the bond. Duration refers to the change in the bond price when market yields change. If the current market yield falls, the bond price will rise, providing the investor with a positive duration return. The reverse occurs—a negative duration return—when the market yield increases.
The third source of return—the roll-down return—is more of a technical factor and, as such, may be less familiar to investors. It is a function of the slope of the yield curve for government bonds.
It arises because the yield on the bond will fall the closer it gets to maturity, generating a positive return if the yield curve is upward sloping. An inverted yield curve, in contrast, will generate a negative roll-down return. Clearly, the steeper the yield curve is, the more powerful the roll-down effect will be. The three sources of total bond returns—yield return plus duration return plus roll-down return—are illustrated in Figure 3 for both a positive and a negatively sloping yield curve.
A Simple Explanatory Model of Treasury Returns
(Fig. 3) Total return = yield return + duration return + roll-down return
Source: T. Rowe Price. The diagram above is for informational purposes only and does not represent any investment recommendations.
Historical Example: U.S. Episodes of Rising Yields
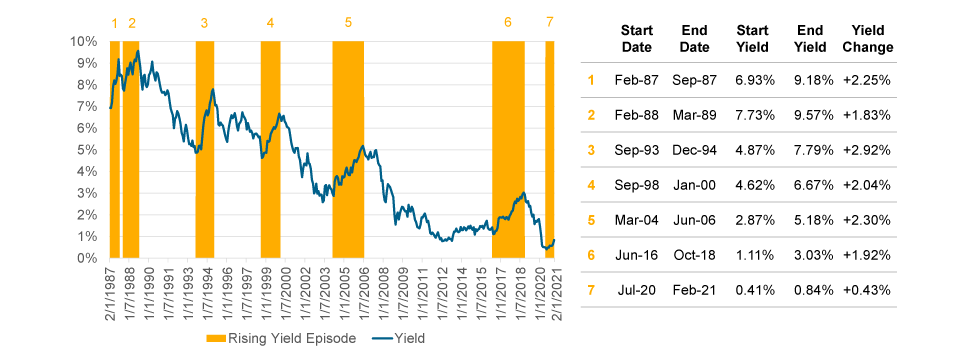
(Fig. 4) Bloomberg U.S. Treasury Index: Periods of rising yields
February 1987 to February 2021. For illustrative purposes only.
Past performance is not a reliable indicator of future performance.
Source for Bloomberg index data: Bloomberg Index Services Limited. See Additional Disclosures. Analysis by T. Rowe Price. Index referred to: Bloomberg Global Treasury—US Treasury (local return).
We ran some simple linear regressions to see whether our three-factor model does a good job explaining total monthly bond returns. As one example, Figure 4 considers periods of rising U.S. government bond yields since 1987, with seven major upcycles identified. Without going into the details, our empirical testing of the model found that it generally performed well in forecasting monthly total bond returns during these historical episodes of rising bond yields.
This is important, since it gives us some confidence when we use the model in the next section in a scenario analysis of potential future returns as rates rise in the current upcycle that is expected to begin in 2022. The main takeaway is that the regression results for this simple three-variable model of Treasury bond returns produced a very good fit for each of the 10 major government bond indices over their long histories. Using history as a guide, the current yield sell-off may be in its early stages and could have the potential to run a lot further. At the very least, it suggests that index-aware global fixed income investors could face a highly challenging environment in 2022.
U.S. Historical Scenarios Suggest Vulnerability to Rising Yields
We use the the Bloomberg Global Treasury—US Treasury (local return) index’s historical record as a basis for our scenario testing. In the scenario simulations, we used February 2021 as the initial or starting yield (1.44% for the 10-year Treasury bond, which is close to the current 10-year yield of 1.42% on December 13, 2021). To this was added the rise in yields that occurred in each of the seven yield upcycles shown in Figure 4 minus the 43 basis points rise in yield since the trough for this cycle in July 2020. The average yield increase over the previous yield rising episodes was 2.22%.
We then used our regression model to project total bond returns under each of these historical scenarios.1 Serving as a strong warning to fixed income investors, the six scenarios generated potential losses for the Bloomberg Global U.S. Treasury Index that varied between 4.3% and 12.6%, as shown in Table 1 below.
Scenario Return Projections from February 26, 2021
(Table 1) Bloomberg Global U.S. Treasury Index—Top 10 countries
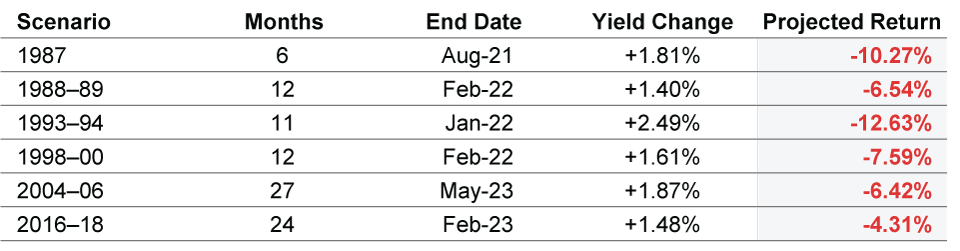
For illustrative, informational purposes only. The scenario return projections shown above are hypothetical and are based on index data that do not reflect actual investment results. Estimated returns can be conditional on economic scenarios; in the event that a particular scenario comes to pass, actual returns could be significantly higher or lower than forecast. Projected returns are based on subjective estimates about market environments that may never occur and are subject to change. Actual results may differ materially from projections. Source for Bloomberg index data: Bloomberg Index Services Limited. See Additional Disclosures. Analysis by T. Rowe Price. Index referred to: Bloomberg Global Treasury–US Treasury (local return). Base period Period ended February 26, 2021.
A Potential Solution: Aggressively Reduce Duration (I)
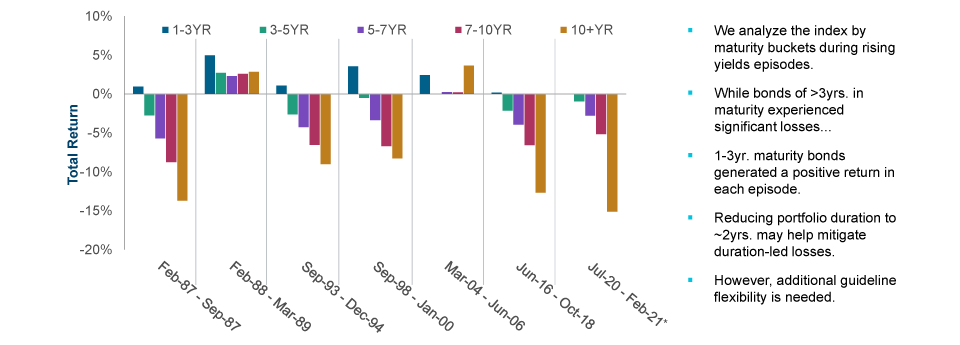
(Fig. 5) Bloomberg US Treasury Index: Performance during rising yield episodes
Past performance is not a reliable indicator of future performance.
For illustrative, informational purposes only. This is not intended to be investment advice or a recommendation to take any particular investment action. Source for Bloomberg Index data: Bloomberg Index Services Limited. See Additional Disclosures. Analysis by T. Rowe Price.
Indexes referred to: Bloomberg Global Treasury–US Treasury 1-3yr., 3-5yr., 5-7yr., 7-10yr., 10+yrs. (local return). *Return for 1-3yr. index was 0.03%.–US Treasury (USD-hedged).
One Suggested Solution to Rising Yield Risks
In order to avoid potential duration losses of 4% to 12% in the next bond yield upcycle that is expected to commence in 2022, one suggested solution would be for investors to aggressively reduce portfolio duration. Figure 5 on page 6 shows clearly that in past periods of rising yields, the longer the maturity or duration, the larger the loss or drawdown. At the short end of the yield curve, in contrast, the returns on one- to three-year bonds were positive in all seven episodes of rising yields. From 1987 onward, the rolling 12-month return from these short-dated government bonds was negative in less than 3% of periods.
A Potential Solution: Aggressively Reduce Duration (II)
(Fig. 6) Bloomberg Global U.S. Treasury Index—wider duration limits would be required
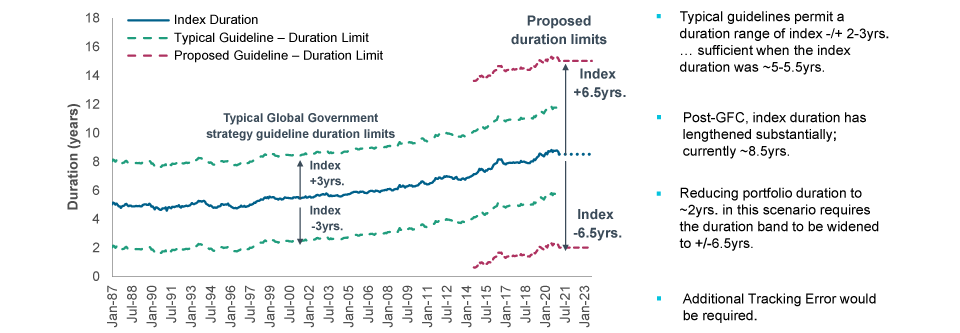
As of July 31, 2021. Illustrative projections to January, 2023. For illustrative, informational purposes only.This is not intended to be investment advice or a recommendation to take any particular investment action.Source for Bloomberg index data: Bloomberg Index Services Limited. See Additional Disclosures.Analysis by T. Rowe Price. Index referred to: Bloomberg Global Treasury–US Treasury (USD-hedged).
Our research suggests that lowering the duration on a portfolio of government bonds to around two years may significantly reduce or even prevent losses from rising yields. But to take duration this low, greater flexibility will need to be built into bond mandate guidelines. These typically permit portfolio duration to deviate from the benchmark by plus or minus two years (See the green dashed lines in Figure 6). While this might have once been adequate, since the global financial crisis and Lehman shock, the duration of the Bloomberg Global U.S. Treasury Index has increased to about eight and a half years. So, in our view, portfolio mandate duration guidelines of plus or minus six and a half years may be necessary to allow an active manager today to reach the two year duration comfort zone. This implies a significantly bigger tracking error budget of around 500 basis points.
Another option would be for the asset owner to adopt an unconstrained global bond portfolio, giving the manager full discretion over the strategy. For example, successful country allocation away from the benchmark can also help to generate positive returns during periods of rising yields. The dispersion of bond returns by country creates an opportunity for duration-neutral portfolio trades, such as long Japan and short the U.S., even when the trend in yields is upward in every market. So, even during periods of rising yields, the global Treasury universe can provide opportunities to generate positive returns for the unconstrained manager who is able to take short positions.
Concluding Thoughts
In this Insights, we have shown that while “yield” explains most of the return in global government bonds over longer-term horizons, in the shorter term this is not so. Over shorter horizons, it is “duration” and yield changes that will likely dominate total returns for fixed income investors. While, so far, the rise in yields during the post-pandemic recovery has been relatively modest relative to history, there is no guarantee that this will continue in 2022. The removal of QE and central bank policy rate hikes are the likely catalyst for higher bond yields in 2022 and potential losses for holders of global government bonds.
One pointer here is that today’s U.S. nominal 10-year yield of 1.42% (as of December 13, 2021) implies a deeply negative real yield, as does the Fed’s ‘“Dotplot” long-term fed funds forecast of 2.5%. Even if inflation starts to fall back later in 2022, real rates would appear to be too low, judged by the old rule of thumb that the real interest rate should converge over time to the long-run potential growth rate of the economy.
For index-aware fixed income investors, aggressively reducing portfolio duration ahead of future yield increases may be the key to mitigating capital losses from rising yields. Decisive action is required in advance, with wealth owners taking care to expand investment guidelines as appropriate in ways that give the asset manager greater flexibility to mitigate duration-led losses in government bond portfolios. For the more conservative type of “buy and hold” fixed income investor, this may be too big a change in the way their bond portfolio has been managed. For less restricted bond investors, the attractions are clear. We believe now is the time for them to revisit their portfolio mandates before the next rising yield cycle exerts its icy grip.
IMPORTANT INFORMATION
This material is being furnished for general informational and/or marketing purposes only. The material does not constitute or undertake to give advice of any nature, including fiduciary investment advice, nor is it intended to serve as the primary basis for an investment decision. Prospective investors are recommended to seek independent legal, financial and tax advice before making any investment decision. T. Rowe Price group of companies including T. Rowe Price Associates, Inc. and/or its affiliates receive revenue from T. Rowe Price investment products and services. Past performance is not a reliable indicator of future performance. The value of an investment and any income from it can go down as well as up. Investors may get back less than the amount invested.
The material does not constitute a distribution, an offer, an invitation, a personal or general recommendation or solicitation to sell or buy any securities in any jurisdiction or to conduct any particular investment activity. The material has not been reviewed by any regulatory authority in any jurisdiction.
Information and opinions presented have been obtained or derived from sources believed to be reliable and current; however, we cannot guarantee the sources’ accuracy or completeness. There is no guarantee that any forecasts made will come to pass. The views contained herein are as of the date noted on the material and are subject to change without notice; these views may differ from those of other T. Rowe Price group companies and/or associates. Under no circumstances should the material, in whole or in part, be copied or redistributed without consent from T. Rowe Price.
The material is not intended for use by persons in jurisdictions which prohibit or restrict the distribution of the material and in certain countries the material is provided upon specific request. It is not intended for distribution to retail investors in any jurisdiction.