November 2021 / U.S. FIXED INCOME
Higher Long-Run Inflation Outlook Makes TIPS Exposure Key
Price rises to slow, but inflation likely to stay relatively high.
Key Insights
- We think that U.S. inflation by the second half of 2022 will settle lower than the latest readings but higher than the Federal Reserve’s 2% target level.
- Energy prices are a key part of headline CPI figures and have broadly increased in late 2021, but we think they are at or near a peak as of early November.
- TIPS should remain valuable in an asset allocation mix as a direct inflation hedge and to pair with nominal Treasuries as a direct deflation hedge.
Inflation has been front and center in the mainstream media as well as the financial press for most of 2021. Because higher prices affect households as well as financial markets, inflation represents the proverbial intersection of Main Street and Wall Street. Consensus inflation predictions for 2021 have been proven almost completely wrong—with prices rising more and staying higher for longer than most anticipated—and the outlook for 2022 appears just as uncertain.
We think that U.S. inflation by the second half of 2022 will settle lower than the latest readings but higher than the Federal Reserve’s 2% target level, which the central bank struggled to attain in most of the period following the 2008–2009 global financial crisis. As a result, we believe Treasury inflation‑protected securities (TIPS) should remain a valuable tool in investors’ asset allocation mix as both a direct inflation hedge and as an asset that should perform relatively well in a major sell‑off in riskier securities such as equities and high yield bonds.
Energy Price Spikes
Energy prices are a key part of headline consumer price inflation (CPI) figures and have broadly increased in late 2021. The price of West Texas Intermediate crude oil, the U.S. benchmark for the commodity, more than doubled in the 12 months ended October 31, 2021. Also, a dramatic increase in natural gas prices in Europe that began late in the third quarter has consumers and businesses in the UK and Continental Europe worried about skyrocketing winter heating costs. U.S. natural gas prices also have more than doubled in the year ended in October.
The energy price spikes largely result from supply failing to fully keep pace with demand as economies around the world reopen in fits and starts. The situation is particularly acute in Europe, where higher shipping costs and competition from Asia for natural gas have suppressed supplies. This has led some energy producers to shift to oil and coal as substitutes for gas in electricity generation, driving their prices up. However, we think that energy prices are at or near a peak as of early November.
U.S. energy production, measured by oil rig counts, has been slow to rebound following the price crash at the beginning of the pandemic in March 2020. However, we anticipate that rig counts will grow over time as producers strive to take advantage of the relatively low cost of production in an environment of elevated prices. Combined with a post‑winter reduction in demand, the growing supply should bring prices down in the spring of 2022. We expect a similar dynamic in Europe, with high prices dampening demand and the likely addition of Russian natural gas exports boosting supply.
Supply Chain Problems
The well‑publicized supply chain problems and labor shortages affecting industries as varied as toys made in China to automobiles manufactured in the U.S. or the eurozone have contributed to unheard‑of price increases in some segments, such as used cars. These supply chain and labor market issues have already persisted for longer than many observers originally anticipated. The market consensus in early November was that the peak of the supply chain disruptions had already occurred, meaning that the problems had stopped worsening.
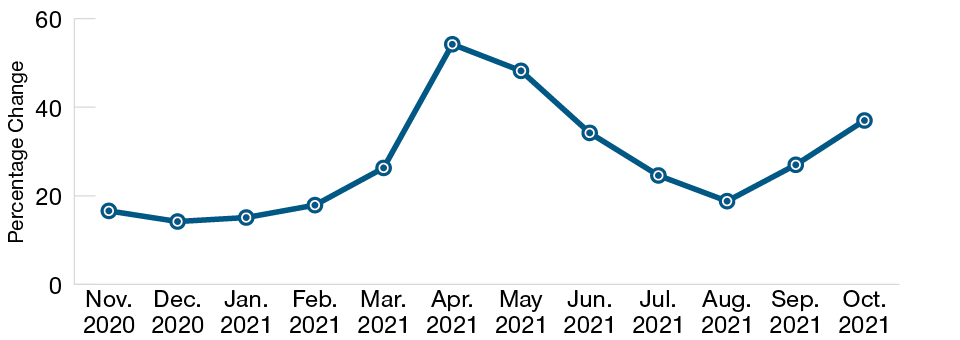
Used Vehicle Price Increases Fluctuate
(Fig. 1) Supply chain issues drive used car prices1 higher

As of October 31, 2021.
Source: Bloomberg Finance L.P.
1Year-over-year percentage change in Manheim Used Vehicle Value Index.
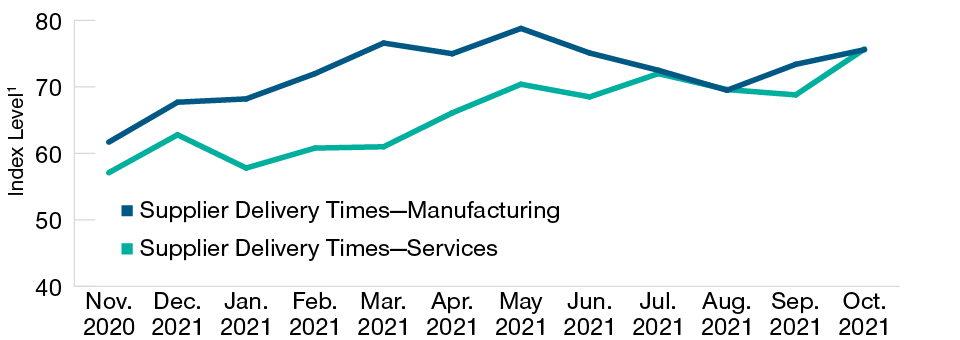
However, we believe that the data suggesting that supply chain issues have stopped getting worse are a function of the third‑quarter growth slowdown resulting from the spread of the delta variant, not actual improvement in supply problems. Supplier delivery times, used car prices, gasoline and food prices, and refrigerated trucking rates have all ticked up as the delta wave has subsided. This could indicate that the supply chain problems may still worsen, supporting inflation well into the first half of 2022. We are carefully monitoring these data points for confirmation.
Supplier Delivery Times Lengthen
(Fig. 2) Delivery times continue to show supply delays

As of October 31, 2021.
1A level above 50 indicates slower deliveries; a level below 50 indicates faster deliveries.
Source: Bloomberg Finance L.P.
Manufacturing supplier delivery times represented by the Institute for Supply Management (ISM) Manufacturing Purchasing Managers Index (PMI) Report on Business Supplier Deliveries.
Services supplier delivery times represented by the ISM Services PMI Report on Business Supplier Deliveries.
We also anticipate that more workers will return to the labor force across a range of industries as the late‑summer wave of the delta variant hopefully continues to recede and schools and daycare centers remain open. A larger pool of available workers should help reduce wage pressures that raise costs for businesses and are ultimately passed on to consumers. The flip side of this dynamic is that the improved virus situation should support a rebound in fourth‑quarter growth, boosting demand and helping to keep inflation elevated for a somewhat longer period.
Upward Trajectory for Shelter Costs
Shelter costs, which are a component of services inflation and include rent and a calculated cost of living in one’s own home called owners’ equivalent rent, account for about one‑third of CPI. Rents softened in 2020 as people shifted to working from home, allowing them to move out of high‑density, high‑rent urban areas. Housing prices broadly rose amid growing demand for more living space and a lack of new housing supply. Mortgage rates fell to record lows as Treasury yields plummeted at the onset of the pandemic, further boosting housing demand and home prices.
Because the CPI only samples rent and owners’ equivalent rent approximately every six months, there is a lengthy lag in seeing its effects on overall inflation figures. Also, the government’s 2020 moratorium on renter evictions has ended, which could trigger more renter turnover and allow landlords to raise rent. The most meaningful rent increases tend to occur with new leases, and we anticipate that returning demand for urban apartments will push rents higher. As a result, we expect shelter prices to increase about 5% on the year‑earlier period over the next six months.
Overall Inflation Likely at Peak
Looking at the different components of broad inflation measures, we think that the overall level of price increases is probably near its peak in early November. Inflation is likely to start to decline in the second half of 2022, when falling energy and goods prices should begin to offset climbing shelter prices. However, we do not anticipate that inflation will fall to the sub‑2% levels experienced for most of the last 10 years.
The Federal Reserve’s relatively new flexible average inflation targeting (FAIT) framework, which allows the central bank to let the economy expand quickly enough to exceed the 2% inflation target to offset previous periods of below‑target inflation, should support structurally higher inflation in the long run. This would be broadly positive for TIPS. However, if labor costs continue to rapidly rise, the Fed could accelerate its tapering of bond purchases and tighten policy at a faster pace, which would be negative for the TIPS market.
TIPS Remain an Important Diversified Portfolio Component
Looking at the longer term, we believe that TIPS will retain their properties as an effective hedge against the harmful effects of inflation—particularly unexpected inflation—on the real (inflation‑adjusted) returns of a diversified portfolio. We also anticipate that they will likely perform relatively well in an inflation‑driven sell‑off in risk assets such as equities. Shorter‑term TIPS would be the most effective hedge against inflation risk, while longer‑maturity TIPS, with their higher interest rate risk, are typically a better fit for hedging against a drop in risk assets.
Because nominal Treasuries have also tended to benefit from their “safe‑haven” status in periods of intense market risk aversion and deflationary environments, exposure to a combination of TIPS and nominal Treasuries should likely be a key component of an investor’s overall portfolio allocation, in our view.
What We’re Watching Next
The interaction of current oil prices and production decisions from both the Organization of Petroleum Exporting Countries and Russia (known as OPEC+) and U.S. oil producers can have a meaningful effect on the longer-run trajectory of oil prices. We monitor how the cost of oil production, geopolitical factors, and secular change from the transition to renewable energy can influence the respective production decisions of OPEC+—akin to a “central bank of oil”—and U.S. oil companies that respond more to the profit motive.
IMPORTANT INFORMATION
This material is being furnished for general informational and/or marketing purposes only. The material does not constitute or undertake to give advice of any nature, including fiduciary investment advice, nor is it intended to serve as the primary basis for an investment decision. Prospective investors are recommended to seek independent legal, financial and tax advice before making any investment decision. T. Rowe Price group of companies including T. Rowe Price Associates, Inc. and/or its affiliates receive revenue from T. Rowe Price investment products and services. Past performance is not a reliable indicator of future performance. The value of an investment and any income from it can go down as well as up. Investors may get back less than the amount invested.
The material does not constitute a distribution, an offer, an invitation, a personal or general recommendation or solicitation to sell or buy any securities in any jurisdiction or to conduct any particular investment activity. The material has not been reviewed by any regulatory authority in any jurisdiction.
Information and opinions presented have been obtained or derived from sources believed to be reliable and current; however, we cannot guarantee the sources’ accuracy or completeness. There is no guarantee that any forecasts made will come to pass. The views contained herein are as of the date noted on the material and are subject to change without notice; these views may differ from those of other T. Rowe Price group companies and/or associates. Under no circumstances should the material, in whole or in part, be copied or redistributed without consent from T. Rowe Price.
The material is not intended for use by persons in jurisdictions which prohibit or restrict the distribution of the material and in certain countries the material is provided upon specific request. It is not intended for distribution to retail investors in any jurisdiction.
November 2021 / VIDEO
November 2021 / VIDEO