
March 2021 / RETIREMENT INSIGHTS
Decoding Retiree Spending
A better understanding of spending patterns may transform retirement income solutions
Key Insights
- Income replacement strategies often assume inflation-adjusted spending in retirement is flat; however, the data reveals that retiree spending declines annually by 2%, and it varies by wealth.
- Retirees typically choose to adjust their nondiscretionary spending (often considered fixed spending) to match their guaranteed income, challenging the notion that these expenses are truly fixed.
- Retiree spending behavior reveals a preference for asset preservation. Aligning products and services that account for this will hasten adoption of retirement income solutions.
Understanding how retirees make their spending decisions is crucial to creating retirement income strategies. Studies show that retirees spend less as they age. But why they spend less and how they determine how much to spend is less well understood. Fear of running out of money could be a motivating factor, but what else influences how much people spend?
Employers and plan sponsors need to understand the motivations behind retiree spending in order to provide optimal retirement income solutions. Defined contribution (DC) plans are quickly becoming the major source of wealth for retirees. For some, this may be the largest amount of money they have, and this is where they will be taking distributions to cover retirement expenses. Employers, as sponsors of DC plans, are a key party to this process. Accordingly, many employers are beginning to think or rethink about what role they can or should play in providing retirees with tools to help draw down their DC plan assets in retirement.
To better grasp what drives retiree spending, T. Rowe Price used data from a longitudinal panel of 1,470 households interviewed between 2001 and 2015 from the Health and Retirement Study (HRS)1 and its supplement, the Consumption and Activities Mail Survey (CAMS).
Spending Changes With Age
Conventional thinking believes that nondiscretionary spending—basics like housing, food, and utilities—is fixed and does not change over time. However, if we look closer, most of us do have some choice over how much we spend on these items. For example, one might move from New Jersey to Arizona to lower the housing costs or buy groceries in less expensive stores. While housing and food remain indispensable spending items, there are ways to live or shop more economically.
The data shows that the decline in overall retiree spending is primarily driven by a decrease in nondiscretionary spending. Looking at how median annual household spending changes between ages 65 and 90 (Fig. 1), we found that inflation-adjusted or real spending declines at an annualized rate of 2%.
Steady Decline in Retiree Nondiscretionary Spending Drives Down Total Spending
(Fig. 1) Inflation-adjusted total household spending declines by 2% annually after age 65
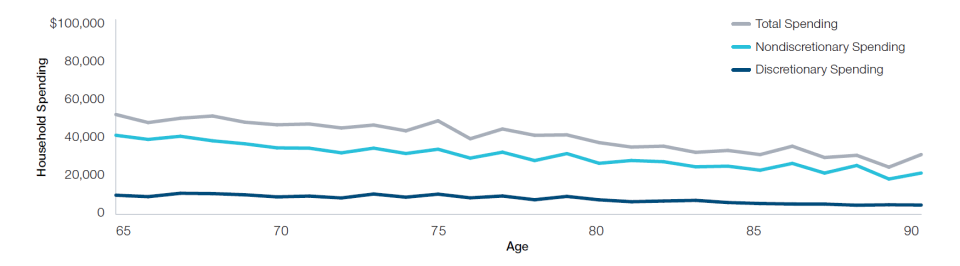
Source: T. Rowe Price estimates from Health and Retirement Study (2001–2015).
Spending Is Personal and Varies by Net Worth
While spending goes down for most retirees as they age, the extent of this decline varies widely. Spending is primarily a function of one’s wherewithal, so we looked at how spending varies by net worth (defined as financial assets including value of a primary residence less all debt including a primary mortgage).
We examined the annual spending trends for households in the top 20% (Fig. 2) and bottom 20% (Fig. 3) of net worth. These households had a net worth of more than $667,000 or less than $37,000, respectively. Two different patterns emerge.
- Spending for the top 20% drops rapidly after 65, remains mostly flat between 70 and 80, and then declines rapidly again. However, spending for the bottom 20% remains largely flat.
- Median spending drops at a much faster rate for those in the top 20%. The annualized decline in real household spending is 2.7% compared with only 0.3% for the bottom 20%.
Reduced Spending in High-Net-Worth Households Is Driven by Reduced Nondiscretionary Spending
(Fig. 2) Median household spending declines 2.7% annually for the top 20% of net worth
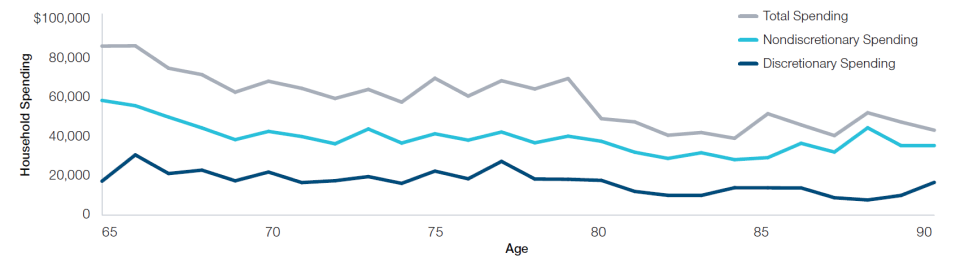
Source: T. Rowe Price estimates from Health and Retirement Study (2001–2015).
Low-Net-Worth Households’ Spending Is Flat and Consists Mostly of Nondiscretionary Expenses
(Fig. 3) Median household spending declines by only 0.3% annually for the bottom 20% of net worth
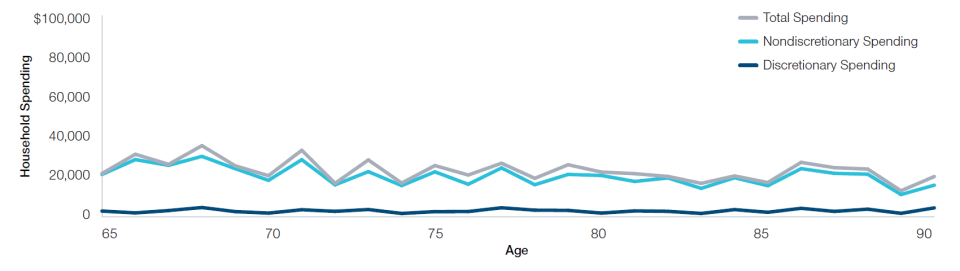
Source: T. Rowe Price estimates from Health and Retirement Study (2001–2015).

Important Information
This material is provided for general and educational purposes only and is not intended to provide legal, tax, or investment advice. This material does not provide recommendations concerning investments, investment strategies, or account types; it is not individualized to the needs of any specific investor and not intended to suggest any particular investment action is appropriate for you, nor is it intended to serve as the primary basis for investment decision-making.
The views contained herein are those of the authors as of March 2021 and are subject to change without notice; these views may differ from those of other T. Rowe Price associates.
This information is not intended to reflect a current or past recommendation, investment advice of any kind, or a solicitation of an offer to buy or sell any securities or investment services. The opinions and commentary provided do not take into account the investment objectives or financial situation of any particular investor or class of investor. Investors will need to consider their own circumstances before making an investment decision.
Information contained herein is based upon sources we consider to be reliable; we do not, however, guarantee its accuracy.
All investments involve risk. All charts and tables are shown for illustrative purposes only.
T. Rowe Price Investment Services, Inc., distributor, and T. Rowe Price Associates, Inc., investment advisor.
©2021 T. Rowe Price. All rights reserved. T. Rowe Price, INVEST WITH CONFIDENCE, and the Bighorn Sheep design are, collectively and/or apart, trademarks of T. Rowe Price Group, Inc.
March 2021 / INVESTMENT INSIGHTS
