May 2021 / MULTI-ASSET SOLUTIONS
PULSe Indicator: Stability on the Surface, Currents Underneath
Vaccination rollout/lockdowns lower pandemic risk
Key Insights
- In the March quarter the Pulse indicator decreased thanks to a meaningful drop in the Pandemic factor from the crisis zone to the stable zone.
- The Liquidity factor rose to the elevated zone, a sign of concern in credit markets. Uncertainty fell into the complacency zone, ending Q1 in the stable zone.
- Despite improving over the quarter, March saw a reversal. PULSe rose moderately due to a deterioration in the Pandemic, Uncertainty, and Liquidity factors.
PULSe is a composite indicator that is designed to monitor the state of global financial markets since the coronavirus crisis. It stands for Pandemic, Uncertainty, Liquidity, and Sentiment — four factors that we believe encompass much of the market’s dynamics. High positive values of PULSe are typically a negative sign for market stability.1
As of March 31st, the PULSe indicator is characterized as Stable.
- The Pandemic (P) factor abated from the Crisis zone to the Stable zone over the first quarter.
- The Uncertainty (U) factor entered the Complacency zone twice and ended the quarter in the Stable zone.
- The Liquidity (L) factor rose to the Elevated zone.
- The Sentiment (Se) factor stayed in the Stable zone.
During March, the PULSe indicator increased due to the deterioration of the Pandemic (P), the Uncertainty (U), and the Liquidity (L) factor.
- The Pandemic factor climbed over the past month as the increase in daily new cases in the U.S., Germany and Japan outweighed the recovery of retail mobility in these regions.
- The Uncertainty factor rose as copper prices dropped, the pace of increases in long-term government yields decelerated, and improvements in earnings forecasts slowed down. Economic Uncertainty may be flirting with complacency.
- The Liquidity factor also shot up as the U.S. 3-month commercial paper spread widened, and the U.S. high yield energy spread contracted less than the U.S. high yield ex-energy spread.
- The Sentiment factor declined as the equity put/call ratio fell and the market- implied volatility factors such as VIX abated.
Visualizing the PULSe Indicator
(Fig. 1) Expressed as an average of the four component indicators
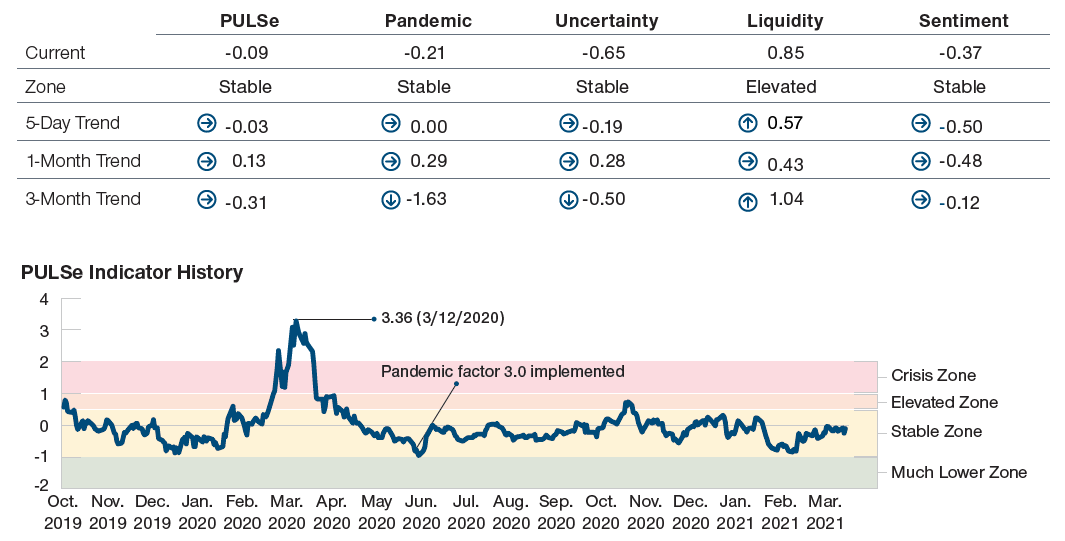
As of March 31, 2021.
Source: Haver Analytics/Bloomberg Finance L.P. Analysis by T. Rowe Price.
For illustrative purposes only. Subject to change. The PULSe indicator has been developed by T. Rowe Price. Using different underlying indicators and data could yield different results. Future outcomes may differ significantly. Note positive indicator values are typically a negative sign for market stability. A higher number indicates the division of PULSe into zones is subjective, based on historical data and statistical assumptions. “Trends” represent the change in the given indicator over the stated period. Please see additional disclosures on the PULSe indicator at the end of this paper.
Radar Chart Showing the PULSe Indicator and Its Components
(Fig. 2) Radial axes expressed as z‑scores (number of standard deviations from the mean)
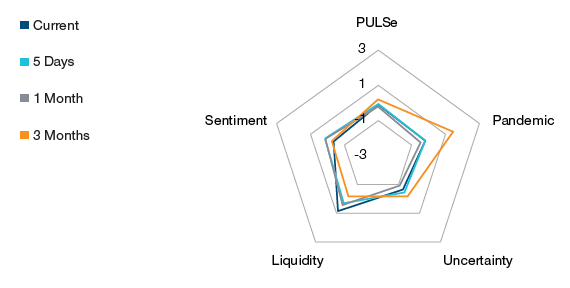
As of March 31, 2021.
Sources: Haver Analytics/Bloomberg Finance L.P. Analysis by T. Rowe Price.
For illustrative purposes only. Subject to change. The PULSe indicator has been developed by T. Rowe Price. Using different underlying indicators and data could yield different results. Future outcomes may differ significantly. “5 days,” “1 month,” and “3 months” represent the z-score readings at those time periods prior to the current. Please see additional disclosures on the PULSe indicator at the end of this paper.
The Four Components of PULSe
(Fig. 3) Currently only liquidity is elevated
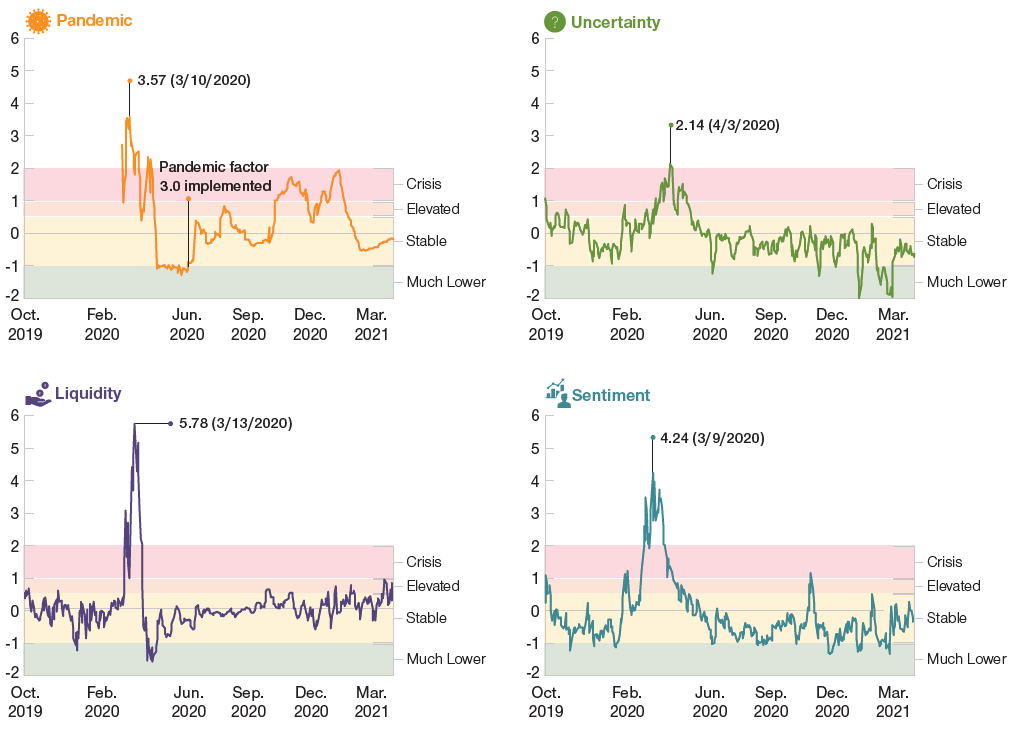
As of March 31, 2021.
Sources: Haver Analytics/Bloomberg Finance L.P. Analysis by T. Rowe Price.
Indicator level on left-hand side expressed as a z-score and subjective stability zone on right-hand side of each chart.
For illustrative purposes only. Subject to change. The PULSe indicator has been developed by T. Rowe Price. Using different underlying indicators and data could yield different results. Future outcomes may differ significantly. Note positive indicator values are typically a negative sign for market stability. The division of PULSe into zones is subjective, based on historical data and statistical assumptions. Please see additional disclosures on the PULSe indicator at the end of this paper.
Background Note
In this note, we highlight two factors that contributed meaningfully to the PULSe indicator over the last month of the first quarter: the new virus wave continued to spread in Japan, and the equity put/ call ratio declined since late-February, indicating improving market sentiment.
1. The new virus wave continued to spread in Japan
At the beginning of the Covid-19 outbreak, we used daily new cases as the sole input data to construct the Pandemic factor. In early July, we made significant enhancements to the calculation of the Pandemic factor as more high frequency data (positive test ratio, Google retail mobility data) became available. We believe that these enhancements better reflect how financial markets react to the virus news. In the current Pandemic factor model, we look at three key metrics: 1) Daily new cases to track the spread of the Covid-19 virus; 2) Positive testing ratios to confirm the trend of the diffusion curves; and 3) Google retail mobility data to assess the ongoing impact of the pandemic on consumer behavior.
In early March, the Japanese government extended the state of emergency, which had been due to end on March 7, for two more weeks to combat the virus spread in Tokyo and three neighboring prefectures. On March 21, after the central government and public health experts noted that infections had declined from the peak and hospital bed occupancy rates had fallen sufficiently, Prime Minister Suga formally decided to end the restrictions. Since then, we have observed a pick-up in daily new cases. The pace of Japan’s vaccination rollout has significantly lagged behind other G7 countries due to insufficient imported vaccines. Currently, only about 1% of the population has been vaccinated, concentrating on medical workers. Shots for the elderly population over the age of 65 are only due to start in April.
Since late 2020, we have observed a pattern that whenever the Japanese government has loosened social restrictions, Google mobility data has improved while daily new cases have risen, forcing the government to declare a state of emergency once again. We think it will take a material speed-up of the vaccination rollout campaign to break this pattern.
Rising New Cases in Japan Threaten Retail Mobility
(Fig. 4) Japan Google retail mobility data and daily new cases
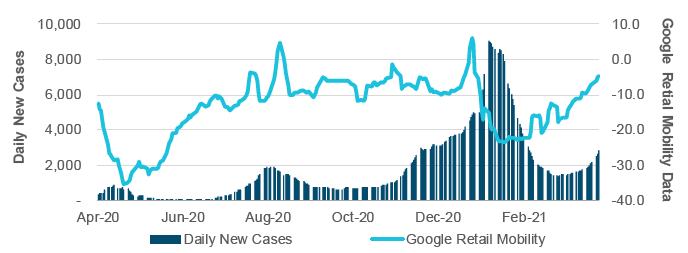
As of March 31, 2020.
Sources: Haver Analytics/Bloomberg Finance L.P.
A Drop in the Put/call Ratio Indicates Improving Market Sentiment
(Fig. 5) Equity Put/Call Ratio (5-day moving average)
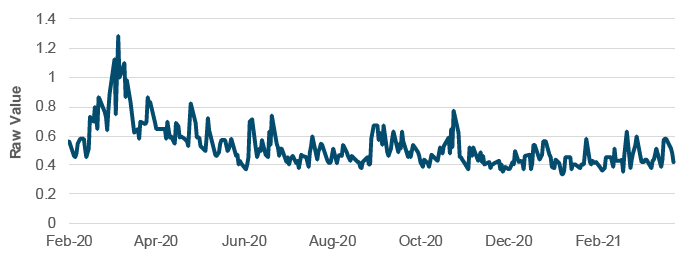
As of March 31, 2020.
Sources: Haver Analytics/Bloomberg Finance L.P.
2. The equity put/call ratio has declined
Since the initial spike following the first wave of Covid-19 outbreaks in 2020, the Equity Put/Call Ratio has continued to abate, reflecting the drop in demand for hedging and the recovery of investor confidence. Since December, it has trended sideways in a broad channel with considerable short-term volatility.
From mid-February, we continued to notice the selling of high-multiple growth stocks and momentum stocks across regions as a result of higher inflation expectations and long-term government bond yield hikes. At the start of the month, the U.S. Senate approved the Biden Administration’s USD1.9 trillion American Rescue Package on a party-line vote. Critics of the bill pointed to the danger of reigniting inflation by overheating the economy with too much fiscal stimulus, which resulted in increased demand for downside protection.
The equity put/call ratio surged again as it approached the end of the month. On March 26, we observed the unprecedented selling of USD20 billion in block trades as Archegos, Tiger Cub Bill Hwang’s family office, was forced by banks including Goldman and Morgan Stanley to sell shares after some ADR positions moved sharply against him. Two major global banks – Credit Suisse and Nomura – that had participated in so- called swap trades with Archegos warned investors that they might suffer significant losses, which was soon confirmed. This event was another accelerated deleveraging story after the GameStop (GME) short squeeze by retail investors just two months ago.
Concerns over the Archegos episode quickly diminished as investors switched their focus to Joe Biden’s USD2.25 trillion infrastructure plan, which could greatly increase government spending on internet and transportation infrastructure. Subsequently, the equity put/call ratio abated as a result of hopes for faster long-run economic growth. A drop in the equity put/call ratio indicated improving market sentiment. According to data compiled by Goldman Sachs, overall book ex-options leverage remains at a high level, which leaves markets vulnerable to short-term volatility.
IMPORTANT INFORMATION
This material is being furnished for general informational and/or marketing purposes only. The material does not constitute or undertake to give advice of any nature, including fiduciary investment advice, nor is it intended to serve as the primary basis for an investment decision. Prospective investors are recommended to seek independent legal, financial and tax advice before making any investment decision. T. Rowe Price group of companies including T. Rowe Price Associates, Inc. and/or its affiliates receive revenue from T. Rowe Price investment products and services. Past performance is not a reliable indicator of future performance. The value of an investment and any income from it can go down as well as up. Investors may get back less than the amount invested.
The material does not constitute a distribution, an offer, an invitation, a personal or general recommendation or solicitation to sell or buy any securities in any jurisdiction or to conduct any particular investment activity. The material has not been reviewed by any regulatory authority in any jurisdiction.
Information and opinions presented have been obtained or derived from sources believed to be reliable and current; however, we cannot guarantee the sources’ accuracy or completeness. There is no guarantee that any forecasts made will come to pass. The views contained herein are as of the date noted on the material and are subject to change without notice; these views may differ from those of other T. Rowe Price group companies and/or associates. Under no circumstances should the material, in whole or in part, be copied or redistributed without consent from T. Rowe Price.
The material is not intended for use by persons in jurisdictions which prohibit or restrict the distribution of the material and in certain countries the material is provided upon specific request. It is not intended for distribution to retail investors in any jurisdiction.